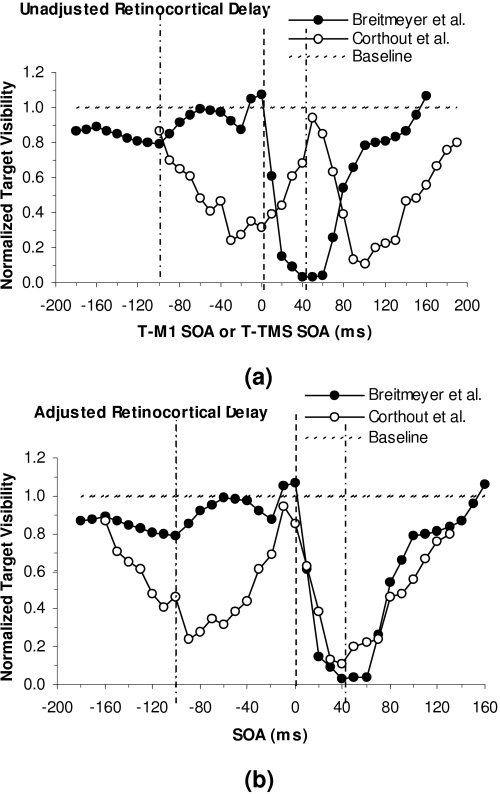
Figure 5.
(a) Comparison of a typical masking function obtained in our laboratory using a visual para- or metacontrast mask and a typical masking function obtained by Corthout, Uttl, Ziemann et al. (1999) using a TMS pulse as a mask. Negative and positive SOAs indicate that the masks were presented before and after the target, respectively. Results are not adjusted for retinocortical transmission delay. (b) Same as preceding but with results adjusted for a 60-ms delay of cortical M activity due to retinocortical transmission time (Baseler & Sutter, 1997). (From Breitmeyer, Ro, Öğmen, 2004)

