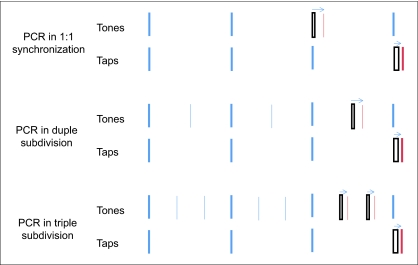
Figure 1.
Schematic illustration of the phase correction response (PCR) in simple and subdivided sequences. Thick vertical bars represent beat tones and taps, thin vertical bars represent subdivision tones. Outline bars represent a tone that has been perturbed or a tap that has undergone a phase shift, in the direction of the arrow above the sequence.

