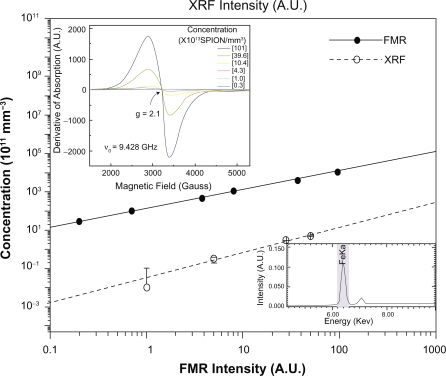
Figure 1.
FMR (solid line) and XRF (dashed line) calibration curves of the SPIONs related to the area under the resonance line at g = 2.1 and the characteristic FeKa line, respectively. In the inset A) there are seen typical FMR spectra for different concentrations of iron, corresponding to the characteristic line of magnetite contained in the ferrofluid Endorem™. Inset B) shows the characteristic FeKa line of XRF, proportional to the iron concentration in the sample.
Abbreviations: FMR, ferromagnetic resonance; SPIONs, superparamagnetic iron oxide nanoparticles; XRF, X-ray fluorescence.

