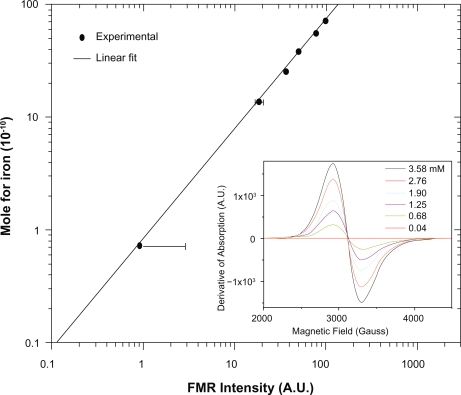
Figure 2.
FMR calibration curve of the SPIONs concentration related with the area under the resonance absorption curve at g = 2.1. In the inset there are presented the typical FMR spectra at different concentrations of magnetite contained in the ferrofluid.
Abbreviations: FMR, ferromagnetic resonance; SPIONs, superparamagnetic iron oxide nanoparticles.

