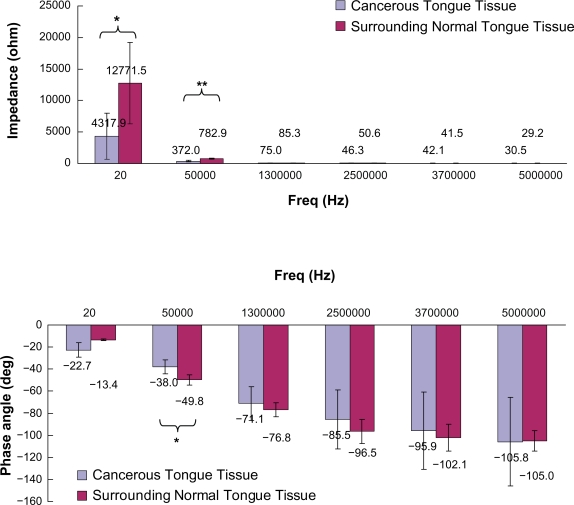
Figure 2.
Impedance and phase angle of cancerous and surrounding normal tongue tissues measured at different frequencies. Results were expressed as means and standard deviations. Statistically significant differences between cancerous and surrounding normal tongue tissues were shown, with P < 0.05 represented by* and P < 0.001 represented by**.

