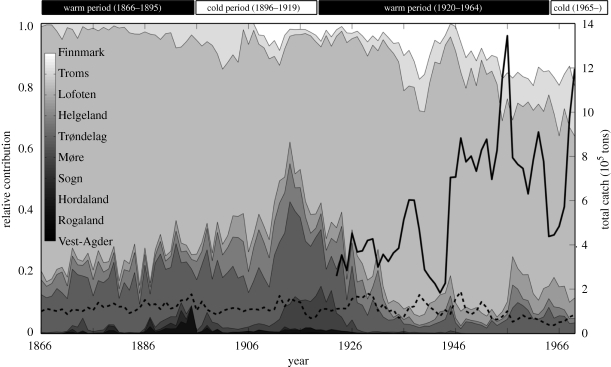
Figure 2.
The proportion of the total catch of northeast Arctic cod caught at the different spawning grounds along the coast. The shaded areas represent the relative contribution from each spawning ground to the total catch from the spawning grounds, and are stacked on top of each other from south in Vest-Agder (bottom, black) to north in Finnmark (top, white). The hatched black line indicates the total catches from the spawning ground fishery, and the continuous black line indicates the total catches from the offshore trawl fishery in the Barents Sea, starting in 1923. The top panels denote the different climatic periods as described in Godø (2003). There is a missing data point for Finnmark in 1945 owing to World War II.

