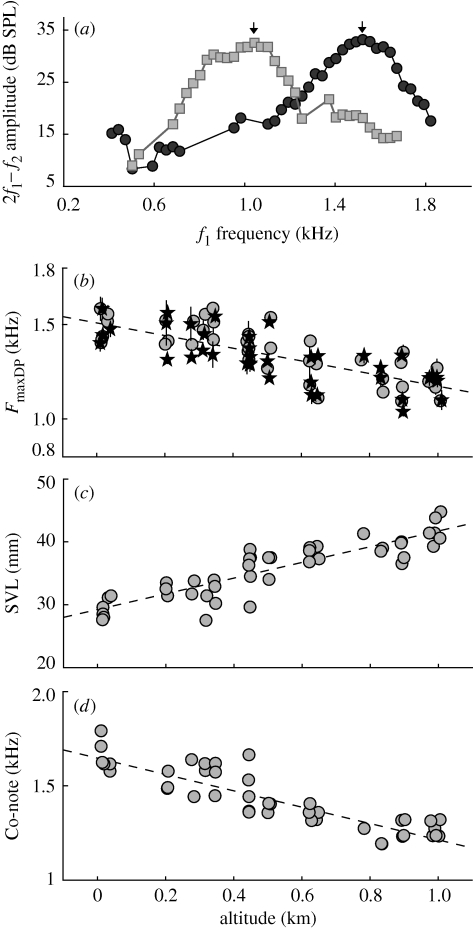
Figure 1.
(a) DPOAE audiograms showing 2f1 – f2 amplitudes for two animals caught at the altitude extremes in this study. Stimulus parameters: f1 = 0.3 … 3.2 kHz in 30 Hz steps; f2/f1 = 1.1; L1 = L2 = 90 dB SPL. Downward arrows indicate maxima in DPOAE audiograms. Filled circles, 30 m (PR57/b); filled squares, 1005 m (PR86/b). Scatter plots showing (b) the frequencies resulting in maximum DPOAE amplitude (FmaxDP), (c) snout-vent length (SVL) and (d) dominant Co-note frequency as a function of altitude. Error bars give interquartile ranges. To avoid overlap, data points were offset by small random numbers along both abscissa and ordinate. (b) shows results for both 2f1 − f2 (grey circles; n = 43) and 2f2 − f1 (black stars; n = 40) DPOAEs. The ordinate gives f1 for 2f1 − f2 and DPOAE frequency for 2f2 − f1 (see text). Data were fitted by straight (dashed) lines: (b) freq = 1.51 − 0.33*Alt, r2 = 0.589; (c) SVL = 29.23 + 12.5*Alt, r2 = 0.777; (d) Co = 1.65 − 0.43*Alt, r2 = 0.773.

