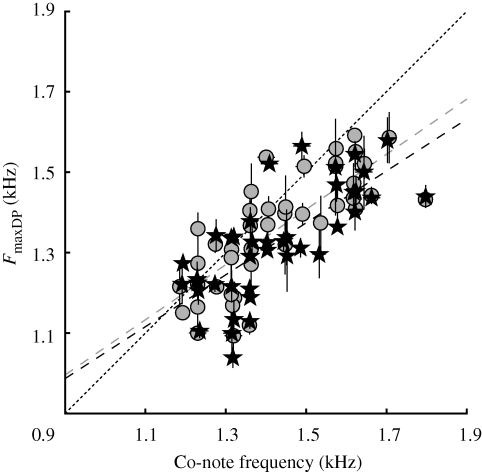
Figure 2.
Scatter plot combining data from figures 1b,d showing the relationship between the frequency at maximum DPOAE amplitude (FmaxDP) and the dominant Co-note frequency in the call. Points give median values ± interquartile ranges. Grey circles, 2f1 − f2; black stars, 2f2 − f1. To avoid overlap, data points were offset by small random numbers along both abscissa and ordinate. The diagonal (dashed) line indicates Co-note frequency FmaxDP. Regression lines to the 2f1 − f2 and 2f2 − f1 data are given; grey dashed line, 2f1 − f2 = 0.37+0.69*Co, r2 = 0.599; black dashed line, 2f2 − f1 = 0.40+0.65*Co, r2 = 0.547.

