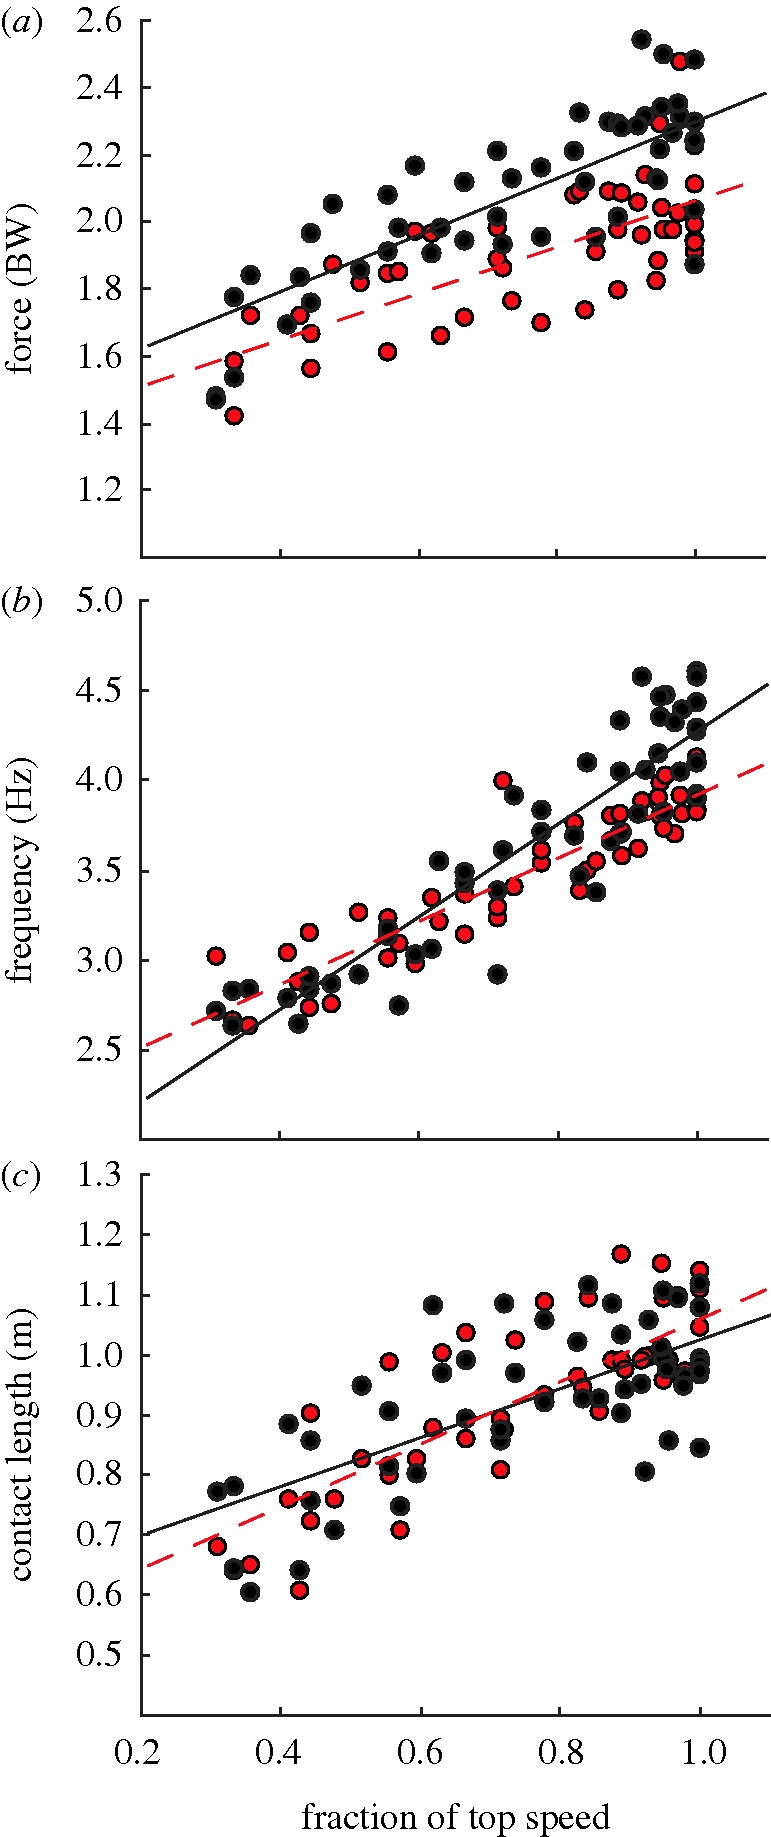
Figure 1.

Biomechanical variables across speed for the UL and AL. Lines are linear regressions for the AL (dashed line) and UL (solid line). R2 > 0.55 for each leg's (a) Favg—stance average vertical GRF, (b) step f—step frequency and (c) Lc—contact length (filled black circle, UL; filled red circle, AL).
