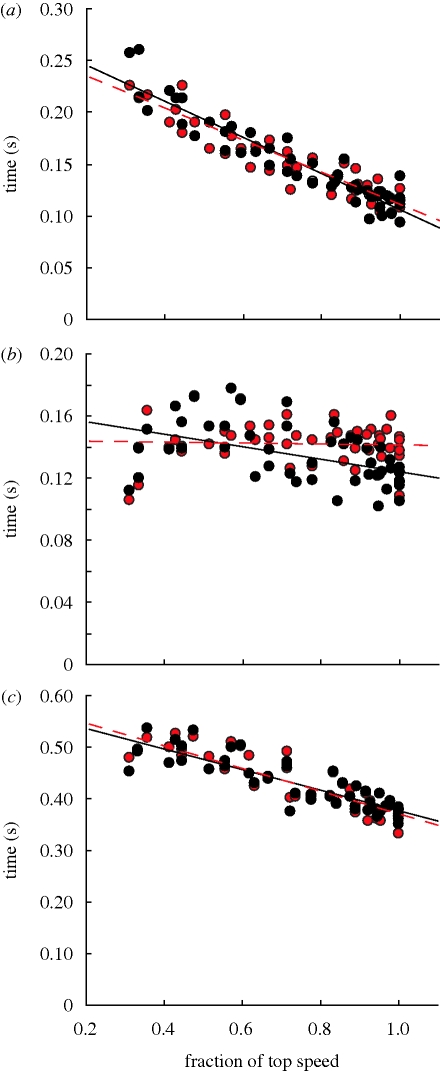
Figure 2.
Plots of (a) tc—contact time, (b) ta—aerial time and (c) tsw—leg swing time across speed for the UL and AL. Lines are linear regressions for AL (dashed line) and UL. R2 = 0.85 & 0.89, 0.00 & 0.20, 0.80 & 0.77 for tc, ta and tsw in the AL & UL, respectively (filled black circle, UL; filled red circle, AL).

