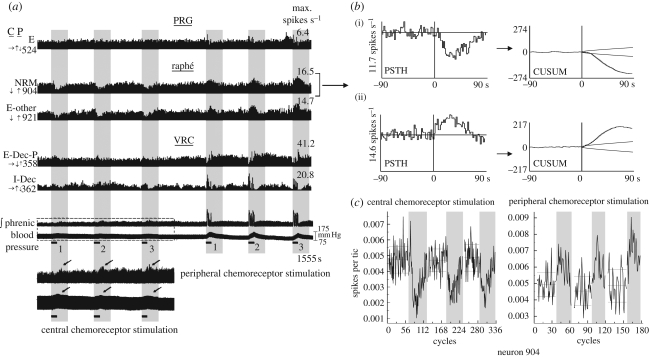
Figure 2.
Simultaneously monitored neurons during repeated sequential stimulation of central and peripheral chemoreceptors. (a) Firing rate histograms of five simultaneously monitored neurons, integrated efferent phrenic nerve activity and arterial blood pressure during repeated sequential stimulation of central (left) and peripheral (right) chemoreceptors. Arrows to the left of each histogram indicate direction of significant change in firing rate in response to central (C) and peripheral (P) chemoreceptor stimulation: increase (↑), decrease (↓) or no change (→); see §2 for significance tests. Firing rates shown on the right refer to the tallest bin (i.e. the maximum rate) in the corresponding histogram. The horizontal black bars denote intervals when solutions were injected to stimulate central or peripheral chemoreceptors; vertical grey panels highlight the response periods. The boxed segment of the phrenic and blood pressure traces (shown with an expanded vertical scale below) indicates data collected during the vertebral injections; arrows denote phrenic-nerve firing rate changes (top trace) and blood pressure increases (bottom). (b) peri-stimulus time histograms (PSTH) and corresponding cumulative sum histograms (CUSUM) detailing the responses of neuron 904 to (i) central and (ii) peripheral chemoreceptor stimulation. The PSTH plots the average firing rate of the cell before and following stimulus onset over the three trials shown in (a); stimulus application began at 0. The CUSUM reflects the data trends seen in the PSTH. (c) Plotted counts of spikes per cycle for three paired control (white vertical panels) and stimulus periods (grey panels) used to calculate statistics; see §2 for details.

