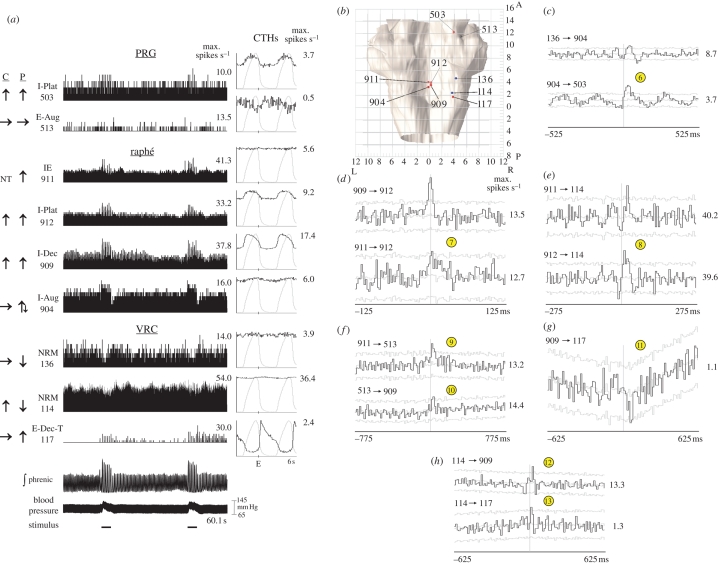
Figure 5.
(Opposite.) Responses to peripheral chemoreceptor stimulation and cross-correlograms selected from one large-scale multi-array recording. (a) Firing rate histograms for nine simultaneously monitored neurons, integrated phrenic nerve activity and blood pressure during two trials of peripheral chemoreceptor stimulation; labelling conventions are as in figure 4. For each CTH, 2758 respiratory cycles were averaged and the binwidth was 60 ms. Numbers of spikes—neuron 503: 25 902 spikes; 513: 3526; 911: 49 505; 912: 72 647; 909: 125 495; 904: 51 885; 136: 33 409; 114: 329 666; 117: 9588. (b) Dorsal view of brainstem showing stereotaxic coordinates of recording sites of neural activity shown in (a). Neuron balls are colour coded according to their primary response to peripheral chemoreceptor stimulation: red, increase; blue, decrease; grey, no change. (c–h) Cross-correlograms with central and offset features suggestive of functional connectivity among the neurons depicted in (a). Grey lines in CCHs represent the mean activity ±3 s.d. in shuffled cycles. Maximum rates are shown to the right of each CCH. CCH plots were independently offset to facilitate display of multiple plots. Circled numbers are the same as in figure legend 4.

