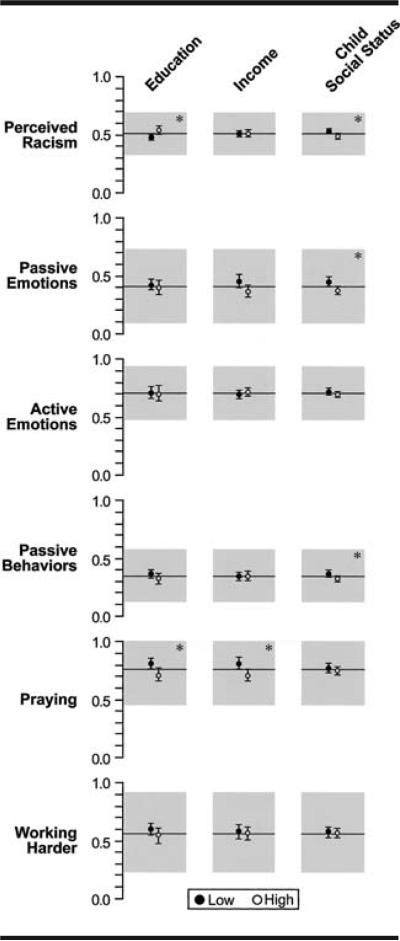
Fig 1.
Association of education, income, and childhood social status with perceived racism and the emotional and behavioral response scales controlling for age. The average scale score for participants is shown for each scale by the horizontal line (standard deviation shown by shading). The estimated mean is shown for the high (open circles) and low (closed circles) categories of education (post-baccalaureate vs high school), income (>$80,000 vs <$20,000), and childhood social status (middle income or well off vs low income or poor). Standard errors of the means are represented by vertical bars. *Indicates a significant association between the social factor and the scale score

