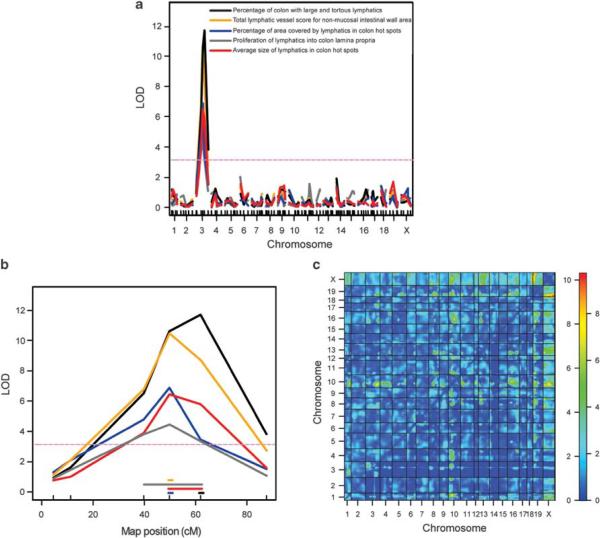
Figure 2.
Mapping of a large-effect QTL for lymphatic vessel inflammatory changes to chromosome 3. (a) The result of interval mapping for five lymphatic vessel subphenotypes (x axis: chromosomes and marker positions, y axis: LOD score). A single locus exceeding the genome-wide 5% significance levels gave a high peak on Chr 3 for all five traits (purple dashed line indicates the significance threshold determined by permutation test). (b) Detailed view of mapped QTL on Chr 3 showing LOD score curves for the five traits, with horizontal lines of matching color indicating the span of 95% approximate Bayesian credible intervals (x axis: marker position in cM). (c) Two-dimensional genome scan performed with 243 F2 mice and 110 microsatellite markers for the total score for lymphatic vessel changes revealed no interaction of the Chr 3 QTL with other loci and a high LOD score interaction between chromosome pairs X:19 and X:18. The upper left triangle contains the interaction model LOD scores, and the lower right triangle contains the conditional-interactive model LOD scores. The color bar indicates the LOD scores for the left and right triangle, respectively.

