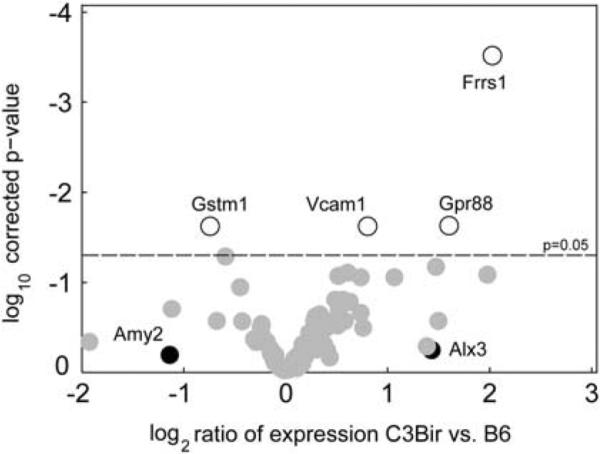
Figure 4.

Gene expression levels in colitis-resistant and -susceptible mouse strains, assessed by high-throughput quantitative PCR. Each circle represents a gene from the Chr 3 QTL interval. The log2 ratio of expression in C3Bir mice, compared with B6 strain is shown on the x axis and log10 of Benjamini-Hochberg corrected P-values are shown on the y axis. Genes that had a statistically significant change between the two strains are shown with open circles. The genes that were expressed at levels below the threshold are shown in black. Genes that were expressed at significantly higher levels in the C3H strain are shown on the right, whereas genes that were expressed at lower levels in the C3H strain are shown on the left (N per strain = 5).
