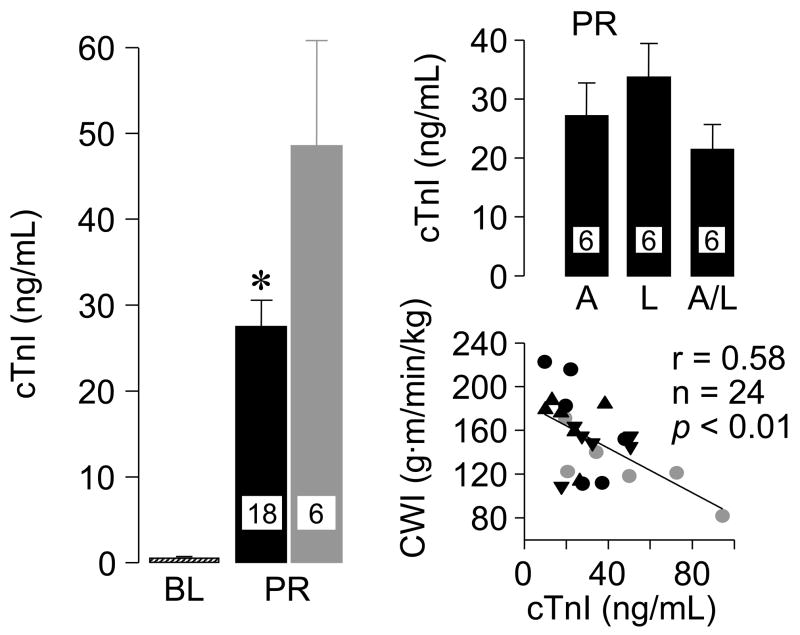
Figure 8.
Cardiospecific troponin I (cTnI) in plasma at baseline (BL) and at 60 minutes post-resuscitation (PR) in rats subjected to ventricular fibrillation and resuscitation. Black symbols represent rats treated with a Na+-limiting intervention (AVE4454 circles, lidocaine inverted triangle, and AVE4454 and lidocaine combined upright triangles). Gray symbols represent control rats. Values are mean ± SEM. *P< 0.05 vs. control by Student’s t-test. The scatterplot depicts the correlation between cTnI and cardiac work index (CWI) at 60 min post-resuscitation. (Adapted from Wang S et al. J Appl Physiol 2007;103:55–65) (48).

