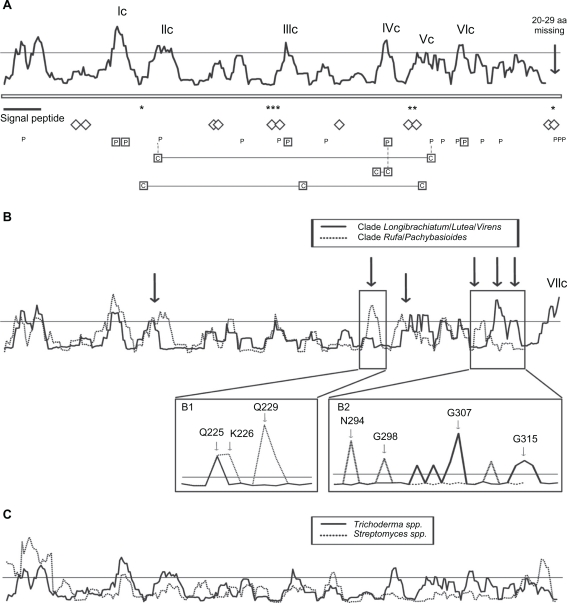
Figure 4.
Reverse conservation analysis of chi18-15 orthologs. A) Amino acid diversity was estimated using Rate4Site, based on a Clustal X alignment of chi18-15 Trichoderma orthologs, and plotted as W mean scores. The y-axis represents arbitrary units (not shown) while a horizontal line indicates a 0.5 standard deviation cutoff. The x-axis represents residue position, asterisks (*) indicate positions of catalytic residues, diamonds (⋄) indicate substrate-interacting residues, boxed P indicate residues under strong (Bayes factor ≥50) positive selection, P indicate residues under weak (Bayes factor 10–49) positive selection, boxed C interconnected by horizontal lines indicate co-evolving residue groups and vertical dashed lines indicate identical residues. The positions of the signal peptide, a C-terminal region not included in the overall analysis and regions with high amino acid diversity successfully visualised by homology modelling are indicated (Ic–VIc). B) Comparison of separate reverse conservation analyses on chi18-15 orthologs from H. minutispora, H. parapilulifera, H. pilulifera, H. atroviridis, H. rufa and T. croceum (dotted line) and T. ghanense, H. jecorina, T. brevicompactum, H. schweinitzii, H. virens and T. longibrachiatum (solid line). Arrows indicate regions with different W mean score distribution, magnifications illustrate residue S score distribution of the selected region. C) Comparison of separate reverse conservation analyses on chi18-15 orthologs from Trichoderma species and ChiJ orthologs from Streptomyces species.

