
Figure 1.
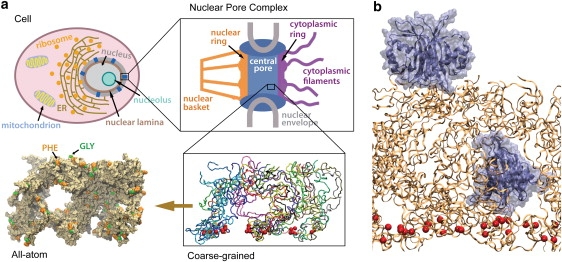
System studied. (a) The top two figures show schematically the cross sections of a typical eukaryotic cell and of the nuclear pore complex. The wild-type brushlike structure of FG-nups adopted in two simulations (ntfm1 and exom6, see text) is shown (bottom right, licorice representation) with each segment depicted in a different color. (Bottom left) The same structure is rendered in surface representation. (b) The initial setup of a molecular dynamics simulation (ntfm1, see text) is shown; a transport receptor (NTF2 dimer) was placed on top of the brush shown in panel a and another one embedded inside. NTF2 dimers are shown in ice blue; the brush segments are colored orange with its constrained Cα atoms (see text) represented by red spheres.