
Figure 6.
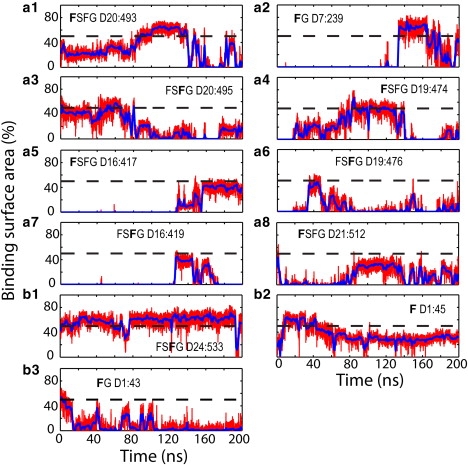
Binding events over the course of simulation exom6. Binding surface areas are shown as percentage of the surface of a phenylalanine side chain. The surface areas shown by red lines were calculated every 10 ps; blue solid lines represent the value averaged over 1-ns windows. The percentage value of 50% is indicated by a dashed black line. Binding events to the top-placed exonuclease are shown in panels a1–a8 and binding events to the embedded exonuclease in panels b1–b3. The phenylalanine of each binding event is identified by a bold letter; its segment name and sequence number are also labeled (see Table 1).