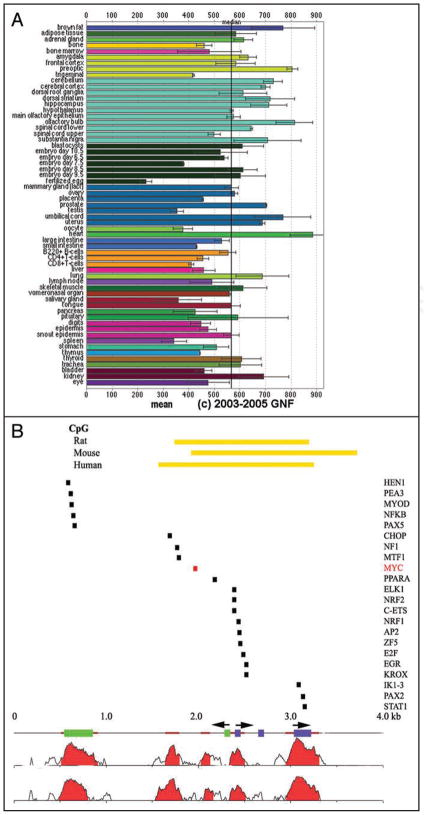
Figure 2.
(A) Tissue-specific expression of TSC2 mRNA was assessed using the transcriptome database at http://symatlas.gnf.org/SymAtlas/.112 Shown are the normalized expression levels of TSC2 in the indicated tissues, presented as mean+/− standard error. (B) An evolutionary analysis of conserved transcription factor binding sites performed using Genome rVista between the human, mouse and rat tuberous sclerosis 2 (TSC2) promoters identifies Myc binding sites as one of several candidate regulators of TSC2 expression.47,59 NTHL1 exons are identified as green rectangles and TSC2 exons as purple rectangles. The two major start sites of TSC2 are identified by arrowheads over the TSC2 exons, and the NTHL1 start site by one positioned over the green rectangles.44,46,57 Homology plots highlight conservation between mouse and human (just below the exon bars) and rat and human (at bottom). Highly conserved, non-coding regions are identified as brown bars and the CpG islands for all three promoters are identified by yellow-orange bars at top. rVista analysis identifies the listed transcription factors as those conserved between all three promoters.

