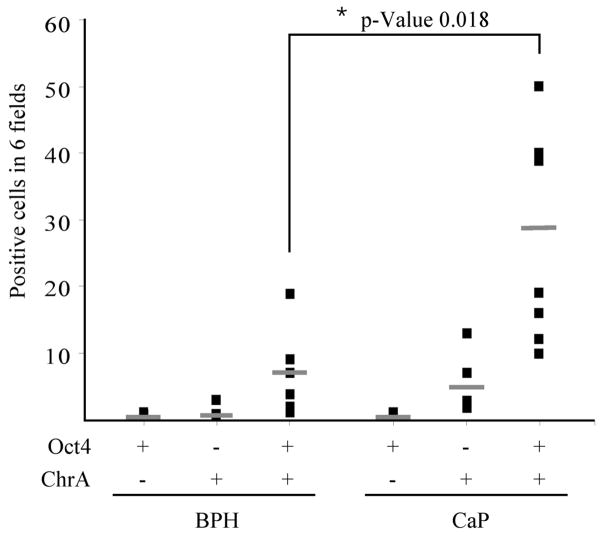
Figure 6. Oct4A and ChrA quantification in CaP compared to BPH.
Total number of Oct4A+/ChrA−, Oct4A−/ChrA+, and Oct4A+/ChrA+ cells in 6 fields for each specimen. n = 6 BPH and n = 7 CaP. Statistical analysis of Oct4A+/ChrA−, Oct4A−/ChrA+, and Oct4A+/ChrA+ cells quantification comparing CaP and BPH. Lines represent the mean. * p-Value = 0.018.

