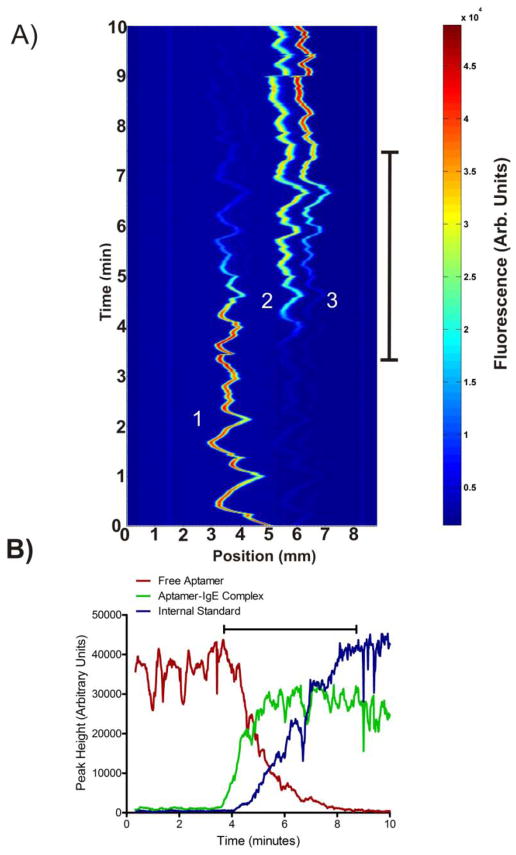
Figure 3.
A) A contour plot showing subsequent μFFE linescans measured over time during the IgE concentration gradient. Peaks are identified from left (anode) to right as 1) the free aptamer, 2) the aptamer-IgE complex, and 3) the internal standard (rhodamine 110). B) A plot of peak area over time for the free aptamer, aptamer-IgE complex and internal standard. Black bars on both plots represent the 5 minute interval over which the concentration of IgE was increased from 0 to 500 nM.

