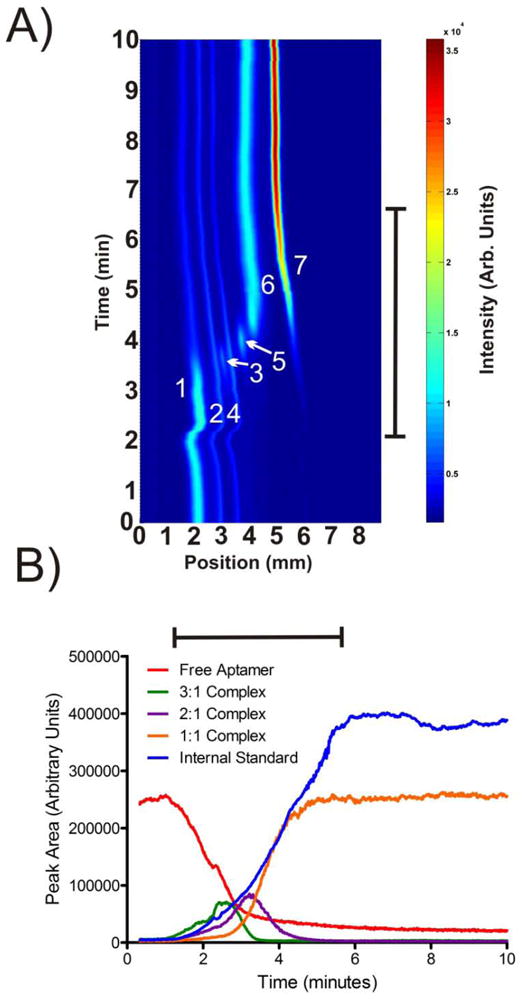
Figure 5.

A) A contour plot showing subsequent μFFE linescans measured over time during the HIV-RT concentration gradient. Peaks are identified as 1) free aptamer, 2) aptamer impurity, 3) 3:1 aptamer: HIVRT complex, 4) aptamer impurity, 5) 2:1 aptamer: HIVRT complex, 6) 1:1 aptamer: HIVRT complex, and 7) internal standard (rhodamine 110). The anode is on the left. B) A plot of peak area over time for the free aptamer, 3:1, 2:1, 1:1 complexes and the internal standard. The black bars denote the 5 minute period over which HIV-RT concentration was increased from 0 to 500 nM.
