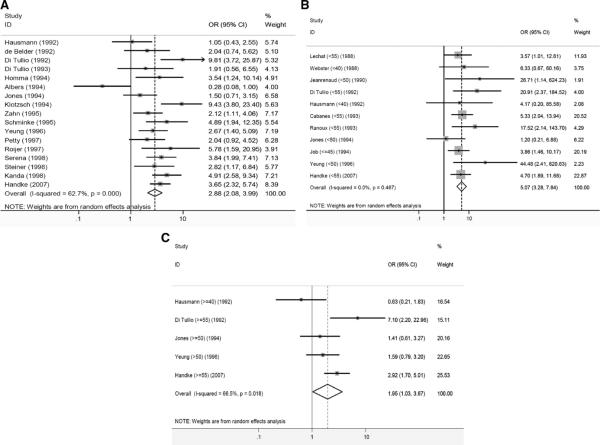
Figure 1.
Forest plots of random-effects meta-analyses of case-control studies examining the prevalence of PFO in cases with CS versus controls with stroke of determined cause. Individual studies are represented on the left with first author and year of publication. Gray boxes with sizes corresponding to each study's weight in the analysis represent the point estimate of the odds ratio (OR) for PFO in cases with CS versus controls with stroke of determined cause with corresponding 95% confidence intervals represented with the black lines. The diamond in the last row represents the summary estimate of the OR. The bold black line in the middle of the panel represents an OR of 1 (i.e. no association between PFO and CS). Panel A: age-inclusive studies, Panel B: analyses in young patients (with age cutoff in parenthesis), and Panel C: analyses in old patients (with age cut-off in parenthesis). [from ref 3]

