Abstract
While biosensors have been constructed using various strategies, there is no report describing nanostructures of antibody-immobilized electrode interface in an immunosensor. Here, atomic force microscopy (AFM) and electrochemistry analyses were employed to construct and characterize the nanostructures and electrochemistry of biosensing surface that was created by a sequential self-assembling of bioactive aminobenzenthiol oligomer (o-ABT), glutareldehyde and anti-transferrin (anti-Tf) antibody on the electrode gold surface. Under AFM, a complete coverage of bioactive o-ABT interface could be achieved by anti-Tf antibody at an optimal concentration. The anti-Tf antibody immobilized on electrode surface of the immunosensor exhibited globular-shape topography with some degree of aggregation. Extensive force-curve analysis allowed mapping the functional spots of the anti-Tf immunosensor. Surprisingly, although immunosensing surface was fully covered by anti-Tf antibodies at the optimal concentration, only about 52% of coated anti-Tf antibody molecules (spots) on the electrode surface were able to specifically capture or bind Tf antigen under AFM. Despite limited functional spots, however, the anti-Tf immunosensor was highly specific and sensitive for sensitizing Tf antigen in solution. The anti-Tf molecules on the immunosensor exhibited a greater molecular force bound to holo-Tf (iron-containing form of Tf) than that to apo-Tf (iron-absent form of Tf). Consistently, the anti-Tf immunosensor had a greater electrochemical capacity to sensitize apo-Tf than holo-Tf, supporting the molecular force-based finding by AFM. Thus, the present study elucidated the nanostructures and molecular force bases for the immunosensing capacity of a highly sensitive capacitive immunosensor.
Keywords: Apo-transferrin, Atomic force microscope, Holo-transferrin, Immunosensor, Nanotechnology
1 Introduction
Immunosensors are affinity ligand-based biosensor devices in which immunochemical reaction is coupled to a transducer. Immunosensors share with conventional immunoassays some fundamental features such as specificity of antigen-antibody reaction and capacity to form immune complex. However, immunosensors are unique for detecting or recording an analyte at a continuous fashion. Although immunosensors have been assessed for electrochemical, optical and microgravimetric aspects, little is known about the nanostructures of biosensing surface of immunosensors [1]. Since immobilization, orientation, thickness, and specificity of coating antibodies on electrodes surface dictate the development of a useful immunosensor, elucidating molecular structure and antigen-antibody interaction on immunosensors at nanoscale levels is therefore of central importance for the construction of a biosensor system with high specificity and sensitivity. Currently, there is no report for nanoscale analyses of biosensing surface of immunosensors and antigen-antibody interaction on the immuno-electrode interface. It is therefore important to explore the nano-structural basis of electrochemical and immunological function in immunosensors.
Atomic force microscopy (AFM) should provide a powerful tool for studying molecular aspects of biosensing interface of immunosensors. Recent progress in AFM-based nanotechnology has made it possible to dissect nanostructures of specific biomolecular interactions [2-4], molecule mapping on the cell and bacteria surface [5-7], and affinity force analysis of antigen-antibody interaction [8]. To examine the nanostructures of electrode-immunological sensing interface on immunosensors, we undertook AFM-based studies of anti-transferrin (Tf) immunosensor in conjunction with electrochemical analyses. To date anti-Tf immunosensor for detecting apo-Tf (iron-absent form of Tf) has not been developed, although the one for holo-Tf (iron-containing form of Tf) was described [9]. We therefore made use of AFM analyses to characterize the nanostructures of evolving biosensing surface that was created by a sequential self-assembling of bioactive aminobenzenthiol oligomer (o-ABT), glutareldehyde and anti-Tf antibody on the electrode interface. We then used this anti-Tf immunosensor as a prototype to elucidate a molecular force for the specific Tf and anti-Tf binding as well as to map functional spots in anti-Tf-immobilized immunosensor. Furthermore, we analyzed nanostructure-based electrochemical characteristics and sensitivity of anti-Tf immunosensor.
2 Materials and methods
Human holo-Tf, apo-Tf, 3-aminopropyltriethoxysilane (3-APTES), 1-hexadecanethiol and glutareldehyde (GA) were purchased from Sigma. Human Tf-specific antibody (anti-Tf) was purchased from Shanghai Reagents Company. 2-aminobenezenethiol (2-ABT) was purchased from Zhejiang Shou & Fu Chemicals and was deoxygenated by bubbling with high purity N2 (99.99%). All reagents used in the experiments were analytical grade.
2.1 Preparations of anti-Tf/GA/o-ABT/Au electrode
The gold electrode was placed in 0.5 m o-ABT/ethanol solutions for 24 h at room temperature and then rinsed with ethanol and DI water. The o-ABT/Au electrode was placed in pH 7.4 PBS solution and electrochemically oligomerized by repeatedly cycling range from −800 to +600 mV versus SCE for 25 times. In order to activate the reaction of o-ABT with anti-Tf, GA was grafted onto the o-ABT/Au in PBS solution (pH 7.4) for 24 h at room temperature. Then the GA/o-ABT/Au electrode surface was washed twice with PBS solution. Finally the electrode was washed by DI water and dried by high-purity N2.GA/O-ABT/Au were dipped in different concentrations of anti-Tf (in PBS) at 4°C for 24 h and the anti-Tf/GA/o-ABT/Au electrode was immersed in 5% 1-hexadecanethiol v/v solution so that the unreacted carbonyl groups were blocked to enhance the specificity of electrode surface.
2.2 Electrode substrate preparation and AFM tips functionalization
The bare gold electrode surface had a root-mean-square (rms) surface roughness of 4.98 nm and an Au island size range of 25–45 nm as revealed by contact mode AFM in air condition. The gold surface height histograms suggested that the height profile is in good normal distribution. Gold electrode surface was polished by Al2O3 and following rinsed by alcohol and etched in 0.5 mol H2SO4 solution by cycling electrode potential from −0.4 V~1.2 V (versus SCE) until a reproducible voltammetric response signals were obtained. Tf may form multiple tethers to the probe tip via any of its amino groups. The holo-Tf- and apo-Tf- functionalized AFM probe tips were shown to be antigenic for binding anti-Tf antibody immobilized on the immunosensor.
Self-assembly anti-Tf grafted gold was prepared in four steps (data not show here). The density of grafted monolayer was controlled by the optimal concentrations of o-ABT and anti-Tf.
Holo-Tf- and apo-Tf-functionalized AFM tips (Thermomicroscope, Si3N4 v-shape cantilever, spring constant 0.01 N/m) were prepared following the steps as previously described [2].
2.3 Stability of immunosensor
The anti-Tf immunosensor was stored in PBS (pH 7.4) at 4°C to test the stability of the electrode capacitance response. The stored anti-Tf immunosensor, upon washing with glucine-HCl buffer pH 3.5, was found to be stable for the induction of capacitance responses, since only about 5–10% decay of the capacitance was noted 30 days after the storage.
2.4 Electrochemical measurements
The cyclic voltammetry and capacitance measurements were performed with a CHI660A electrochemical working station (CH Instruments). A three-electrode system was used with a saturated calomel electrode (SCE) as the reference electrode, a platinum wire as the auxiliary electrode and a gold disk (φ2 mm) coated with a bioactive anti-Tf antibody film as working electrode and immunosensor. The magnitude of capacitance was obtained from the current response by the potentiostatic pulse method in which applied a potentiosatic step of 50 mV on the sensor.
2.5 AFM analysis
An Autoprobe Cp AFM (Thermomicroscope) was used in contact mode in air to perform the topography images at room temperature.
AFM-based force spectroscopy was used to perform the force detection. Force-distance curves were obtained through standard retraction and between Tf-functionalized tips and anti-Tf/GA/o-ABT/Au electrode surface. All force-distance curve experiments were performed at the same loading rate.
2.6 Statistical analyses
Force-distance curves were calculated using the standard formula. The values were statistically analyzed by a student t-test for a significance between the curves generated by holo-Tf tip and apo-Tf tip or either of them and control tip.
3 Results and discussion
3.1 Nanostructures of self-assembled monolayer and anti-Tf immunosensor
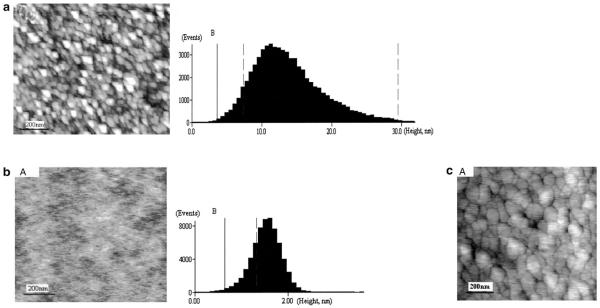
One of the important steps for developing a useful immunosensor is to form uniform monolayer of bioactive interface that can facilitate the immobilization of antibodies with desired binding orientation. Self-assembly strategy has proven to be a well-developed technique for constructing a highly uniform, crystalline-like monolayer, which can provide an excellent model surface to study protein-protein interaction [10]. Although an o-ABT self-assembled monolayer has been used for developing biosensors, there is no report describing the nanostructure of the functional interface in immunosensors. We therefore modified the bare gold substrate with o-ABT and coated the o-ABT bioactive monolayer with anti-Tf antibody. We then used AFM to examine nanostructures of the self-assembled o-ABT monolayer and the anti-Tf immunosensor, which was used for detecting both holo Tf and apo Tf. Under AFM, bare gold electrode surface exhibited 4.98 nm of root-mean-square (rms) surface roughness, and 25–45 nm of Au islands in the air condition (Fig. 1a). Introduction of o-ABT onto the gold electrode surface reduced RMS roughness to the level of 0.3 nm with a relative mean height of 1.55 nm (Fig. 1b). The o-ABT monolayer made it possible to form the cross-link of GA and subsequent immobilization of anti-Tf for the development of an anti-Tf immunosensor. The identified nanostructures of o-ABT electrode surface helped to determine the optimal concentrations of GA and anti-Tf antibody to completely cover the interface of o-ABT monolayer. Gold surface was fully covered by o-ABT at the bulk concentration of 0.5 mol/L, whereas a nice coverage of bioactive o-ABT interface could be achieved by anti-Tf antibody at a concentration of 4 ng/mL (Fig. 1b, c). The anti-Tf antibody-coated electrode surface in the immunosensor exhibited a unique round-shape topography with a relative height 33.0 nm under AFM (Fig. 1c).
Figure 1.
(a) (A) AFM images of bare gold substrate, in which 4.98 nm of root-mean-square (rms) surface roughness, and 25–45 nm of Au islands were indicated. (B) Au surface height histogram. – (b) (A) AFM image of o-ABT functionalized flat Au substrate with 0.3 nm RMS roughness. (B) o-ABT surface height histogram with a relative mean height of 1.55 nm. – (c) (A) AFM images of anti-Tf-coated immunosensor. Note that individual globular (B) anti-Tf-coated immunosensor height histogram. The relative height of anti-Tf/GA/o-ABT/Au is 33.0 nm. Data were obtained using the AFM analytic software provided by the manufacture.
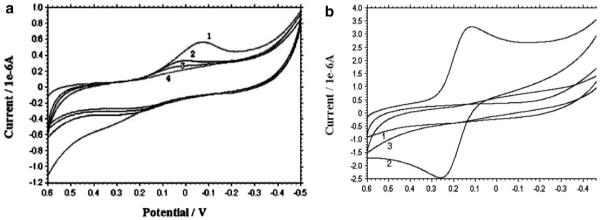
Based on the nanographs of anti-Tf immunosensor, we performed the cyclic voltammetry analysis to confirm electrochemical polymerization of o-ABT monolayer and anti-Tf antibodies self-assembled on the immunosensor. The oxidative peaks disappeared gradually as the scans were performed (Fig. 2a). Sharp oxidative peaks became a plateau and disappeared as scans were performs. Such changes were likely attributed to the reduction of electroactive elements by the o-ABT monolayer. In addition, the peak current decreased because of the polymerization of o-ABT. Similarly, the redox peaks of the couple of Fe(II)/Fe(III) became a plateau and disappeared as a result of the immobilization of anti-Tf on electrode surface (Fig. 2b). The absence of the redox peaks suggested that the surface coating was further improved when anti-Tf was coupled on the GA surface. These results provided functional evidence that the electrical insulation layer of o-ABT or anti-Tf-GA-ABT were formed on bare gold electrode. This electrical insulation layer should make it possible to measure capacitance in immunosensing an analyte. Taken together, findings from AFM and voltammetry analyses provided information regarding the nanostructure and electrochemistry of anti-Tf/ABT electrode interface in anti-Tf immunosensor.
Figure 2.
(a) Cyclic voltamogramms of o-ABT grafted electrode surface in PBS (pH 7.4) (1) the first scan, (2) the 10th scan, (3) the 20th scan, (4) the 25th scan. (b) Cyclic voltamogramms recorded in 1 mm hexacyanoferrate/hexacyanoferrate in PBS. (1) Bare gold electrode. (2) O-ABT grafted gold electrode. (3) Anti-Tf/GA/o-ABT/Au electrode surface. The scan rate was 100 mV/s.
3.2 Specificity and affinity mapping of anti-Tf immunosensor at a single molecule force level
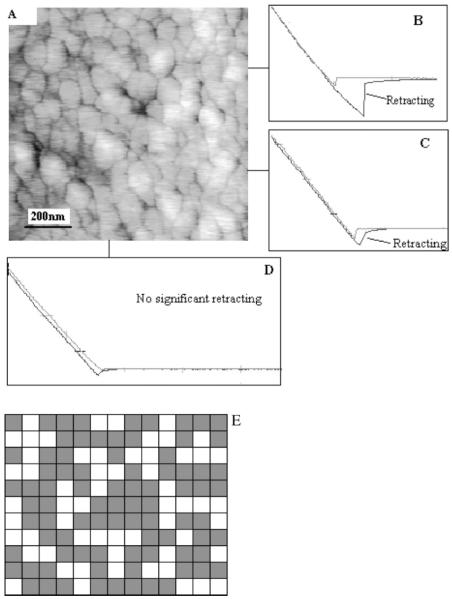
While a highly specific immunosensor allows the detection of an analyte at a low concentration in the presence of much higher concentration of nonspecific molecules [1], unspecific signals of the electrode interface have proven to be one of the major problems for the development of immunosensors. Conventionally, specificity issues are characterized using extensive immunologic approaches during the construction of immunosensors. In the present study, we took advantage of AFM force-distance curve analyses to examine the specificity of the immunosensor comprised of Anti-Tf/GA/o-ABT/Au at the single molecular force level. The Tf-functionalized AFM tips allowed us to measure the single molecular force for antigen-specific binding to antibody on the surface of the anti-Tf immunosensor in the AFM force-distance curve experiments. Figure 3b, c were the representative force-distance curves of the holo-Tf and anti-Tf interaction and apo-Tf and anti-Tf interaction, respectively. The retract phase of the force-distance curve occurred coincident with a magnitude of the force required to break the Tf and anti-Tf bonds formed between Tf-functionalized tip and anti-Tf antibody immobilized on the electrode surface (Fig. 3b, c). The molecular force for holo-Tf and anti-Tf interaction was greater than that for apo-Tf and anti-Tf binding on the anti-Tf immunosensor (p < 0.001, Fig. 3b, c). In contrast, in the control experiments using a bare or fibronetin-coated AFM tips, no retracting phase was found even at the same facet of the anti-Tf-immobilized immunosensor (Fig. 3d). These results demonstrated specific and high-affinity interactions between Tf-functionalized tip and the anti-Tf/GA/o-ABT/Au in the immunosensor.
Figure 3.
(A) Contact mode AFM images of anti-Tf/GA/o-ABT/Au electrode surface. Note that coating the immunosensor with an optimal concentration of anti-Tf diluted by PBS resulted in a full coverage of electrode surface, which exhibited a round-shaped topography. (B) A representative force-distance curve on anti-Tf/GA/o-ABT/Au electrode surface using a holo-Tf-functionalized AFM tip. (C) A representative force-distance curve on anti-Tf/GA/o-ABT/Au electrode surface using an apo-Tf-functionalized AFM tip. This spot yielded the same force curve as seen in Fig. 3B when using holo-Tf-functionalized AFM tip (also see the map in Fig. 3E). p < 0.001 when statistical (student t) analyses tested the difference in force curves between holo-Tf and apo-Tf functionalized AFM tips. (D) A representative force-versus-distance curves on anti-Tf/GA/o-ABT/Au electrode surface obtained via bare AFM tips (similar curves obtained when using fibronectin-functionalized tip). (E) The AFM related antibody mapping feature on the anti-Tf/GA/o-ABT/Au electrode surface with holo-Tf functionalized AFM tips. Each black spot suggests the position where significant adhesive force was detected. All force-versus-distance curves were obtained via the same AFM tip with same spring constant magnitude under the same experimental condition.
We then extended our experience in force-distance analyses to determine the numbers of functional spots, in which anti-Tf antibodies on the surface of immunosensor were able to specifically capture Tf antigens. 143 individual spots in a 1 μm2 area were repeatedly measured for force-distance curves. The detectable cohesive force in each spot of this area resulted in the development of a map that illustrated the distribution of functional spots on the anti-Tf immunosensor. Interestingly, only 74 out of 143 spots possessed the capacity to bind Tf antigen (Fig. 3e). Since each functional spot displayed a similar magnitude of a distance-associated retracting force equivalent to antigen-antibody binding force, there was a reason to predict that each functional spot represents a single immobilized anti-Tf antibody with a right orientation and capacity to bind Tf antigen on the immunosensor [11]. These results therefore suggested that although the whole surface area was fully covered by anti-Tf antibodies at an optimal concentration (Fig. 3a), only 52% of the coating molecules exposed their Fab fragments in such a right orientation that they could capture or bind specific antigen Tf.
3.3 Electrochemical characteristics and sensitivity of anti-Tf immunosensor
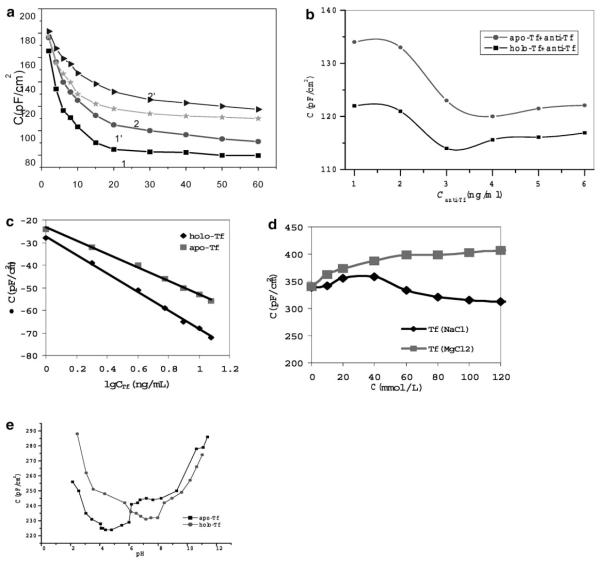
Given the nanostructures and single molecular force-based specificity of this anti-Tf immunosensor, we sought to determine its functional aspects such as electrochemistry and sensitivity for sensing Tf antigens. The capacitance was measured as a readout to examine and quantitate electrochemical and immunosensing functions using RC model [12]. As shown in Fig. 4a, the capacitance magnitude decreased initially and then tended to be stable at the reaction time more than 20 mins after electrode was immersing in the Tf solution. This change suggested that Tf antigen and anti-Tf formed stable immunocomplex on the immunosensor electrode interface [13]. Therefore, the 30-min time course was introduced to record Tf and anti-Tf reaction time in this immunosensor system.
Figure 4.
(a) Capacitance measured over time under different concentrations of Tf using an anti-Tf immunosensor coated with 4 ng/mL anti-Tf antibody. The numbers 1 and 1′ indicate 100 ng/mL of holo-Tf and 100 ng/mL of apo-Tf, respectively; numbers 2 and 2′ represented 10 ng/mL holo-Tf and 10 ng/mL apo-Tf. (b) Net changes in capacitance measured by anti-Tf immunosensors prepared by different concentrations of anti-Tf antibodies. Ten ng/mL of holo-Tf or apo-Tf antigen was used in these experiments. Note the difference in capacitance changes between holo-Tf and apo-Tf sensitizations. (c) Net changes in capacitance measured in an anti-Tf immunosensor under different concentrations of holo-Tf and apo-Tf antigens. Difference in capacitance changes between holo-Tf and apo-Tf sensitizations was also demonstrated. Also see Table 1 for detection limits. (d) Salt concentrations affected the capacitance magnitude in the anti-Tf immunosensor. (e) Changes in pH could readily effect on the capacitance of the anti-Tf immunosensor.
The electrochemical response and biosensing functions of the anti-Tf immunosensor were consistent with what was found under AFM for nanostructures of the immunosensor. While AFM showed that the immobilizing anti-Tf coated at 4 ng/mL reached the complete coverage of the sensing surface of the anti-Tf immunosensor (Fig. 1c), the immunosensor prepared by this concentration generated a maximal change in the magnitude of capacitance in response to Tf antigen flow (Fig. 4b). Further increases in immobilizing anti-Tf concentrations did not generate an immunosensor that could give rise to a bigger change in the magnitude of capacitance (Fig. 4b). It was likely that anti-Tf concentrations higher than the ones in our system would not increase the number of functional anti-Tf spots on the immunosensing surface, presumably because there was no uncoated space left on the surface prepared by anti-Tf, as seen under AFM (Fig. 1c). Thus, functional and AFM analyses both demonstrated that 4 ng/mL of anti-Tf antibody was the optimal concentration for immobilizing the electrode surface of the immunosensor. The immunosensor coated with such concentration had a good detection range from 1.0 to 12.5 ng/mL of Tf antigen, with a detection limit of 0.15 ng/mL for apo-Tf antigen in solution (Fig. 4c, and Table 1). This anti-Tf immunosensor represented a first sensitive biosensor for sensitizing apo-Tf antigen. Although immunosensors for detecting holo-Tf have been reported, our immunosensor was able to detect 0.04 ng/mL of holo-Tf. To our knowledge, this was the lowest value reported so far [14]. Our results indicated that the anti-Tf immunosensor was highly sensitive for sensing Tf at low concentration, although only about 52% of anti-Tf antibody-coated spots were able to specifically bind Tf antigen under the AFM (Fig. 3e). It was worth to mention that molecular force analyses showed that the anti-Tf immunosensor exhibited better binding affinity for holo-Tf than that for apo-Tf under the AFM analysis (Fig. 3b, c). Consistently, electrochemical analyses showed that under the same immobilization concentration of anti-Tf on the electrode surface, the magnitude of capacitance measured for sensing apo-Tf was greater than that for holo-Tf (Fig. 4b, c).
Table 1.
Capacitance data and corresponding detection limits for Holo-Tf and Apo-Tf
| Detection Limit (ng/mL) |
Corresponding capacitance ΔC (PF/cm2) |
RSD RSD% (n = 3) |
|
|---|---|---|---|
| Holo-Tf | 0.04 | −16.7 ± 1.3 | 7.8 |
| Apo-Tf | 0.15 | −20.8 ± 1.4 | 6.7 |
Finally, we sough to examine whether salt concentration and pH could differentially affect the ability of the anti-Tf immunosensor to sense apo-Tf and holo-Tf. To this end, the capacitance magnitude in the anti-Tf immunosensor was measured in buffer containing different concentrations of MgCl2 or NaCl. The capacitance magnitude increased significantly when the concentrations of MgCl2 increased (Fig. 4d). Surprisingly, when the concentration of NaCl increased to a critical point, a decrease, instead of increase, in the magnitude of capacitance was seen in the anti-Tf immunosensor (Fig. 4d). It is likely that an increase in ionic strength of MgCl2 in buffer will neutralize the charge of antigen and antibody and result in the decreasing of affinity between antigen and antibody, therefore continuously generates a greater magnitude of capacitance. While an optimal concentration of NaCl may help to form a complex, highly concentrated NaCl may detach immobilized anti-Tf antibody from the electrode interface, or reduce the binding force between Tf antigen and anti-Tf antibody. These changes can certainly result in the reduction in the magnitude of the capacitance detected in the anti-Tf immunosensor. Furthermore, pH could readily effect on the capacitance of the anti-Tf immunosensor. The optimal pH ranges for the anti-Tf immunosensor were 5.0–6.0 for holo-Tf and 6.5–8.0 for apo-Tf (Fig. 4e). Within these pH ranges, the minimum capacitance for sensing holo-Tf is larger than that for detecting apo-Tf.
Thus, we have conducted a first combined nanoscale and electrochemical study of a highly sensitive capacitive immunosensor. The nanoscale and electrochemical analyses of anti-Tf immunosensor elucidated nanostructures, molecular binding forces, biosensing spots and regulatory factors for the anti-Tf immunosensor that sensitized apo-Tf and holo-Tf. The differences in atomic binding forces between holo-Tf/anti-Tf and apo-Tf/anti-Tf interactions represented molecular bases for the discriminating capacity of anti-Tf immunosensor to sense holo-Tf and apo-Tf antigens.
Acknowledgments
ZWC was supported by NIH grant HL64560 and RR13601. Other authors are supported by the grants from the National 973 Program (2001CB510101), Key Program of National Natural Science Foundation of China (30230350), National Natural Science Foundation of China (60278014), and China’s Guangdong Natural Science Foundation (021190, 2003Z3-D2041,36704), and China’s Guangdong Science and Technology Key Program (2002C32404). The helpful AFM tips modification discussion of Prof. Xiaohong Fang and Dr. Yi Lin (Institute of Chemistry, Chinese Academy of Sciences) are acknowledged. We also thank for the article gifts of Prof. Jarmila Janatova (University of Utah).
Abbreviations
- AFM
atomic force microscopy
- Tf
transferin
References
- [1].Luppa PB, Sokoll LJ, Chan DW. Clin. Chim. Acta. 2001;314:1–26. doi: 10.1016/s0009-8981(01)00629-5. [DOI] [PubMed] [Google Scholar]
- [2].Willemsen OH, Snel MM, Cambi A, Greve J, De Grooth BG, Figdor CG. Biophys. J. 2000;79:3267–3281. doi: 10.1016/S0006-3495(00)76559-3. [DOI] [PMC free article] [PubMed] [Google Scholar]
- [2].Yang Y, Wang H, Erie DA. Methods. 2003;29:175–187. doi: 10.1016/s1046-2023(02)00308-0. [DOI] [PubMed] [Google Scholar]
- [4].Allison DP, Hinterdorfer P, Han W. Curr. Opin. Biotechnol. 2002;13:47–51. doi: 10.1016/s0958-1669(02)00283-5. [DOI] [PubMed] [Google Scholar]
- [5].Dufrene YF. Micron. 2001;32:153–165. doi: 10.1016/s0968-4328(99)00106-7. [DOI] [PubMed] [Google Scholar]
- [6].Touhami A, Jericho MH, Beveridge TJ. J. Bacteriol. 2004;186:3286–3295. doi: 10.1128/JB.186.11.3286-3295.2004. [DOI] [PMC free article] [PubMed] [Google Scholar]
- [7].Scheuring S, Seguin J, Marco S, Levy D, Robert B, Rigaud JL. Proc. Natl. Acad. Sci. USA. 2003;100:1690–1693. doi: 10.1073/pnas.0437992100. [DOI] [PMC free article] [PubMed] [Google Scholar]
- [8].Raab A, Han W, Badt D, Smith-Gill SJ, et al. Natl. Biotechnol. 1999;17:901–905. doi: 10.1038/12898. [DOI] [PubMed] [Google Scholar]
- [9].Liu GD, Hu KS, Li W, Shen G, Yu RQ. Analyst. 2000;125:1595–1599. doi: 10.1039/b004005n. [DOI] [PubMed] [Google Scholar]
- [10].Epand RF, Yip CM, Chernomordik LV, LeDuc DL. Biochim. Biophys. Acta. 2001;1513:167–175. doi: 10.1016/s0005-2736(01)00350-9. [DOI] [PubMed] [Google Scholar]
- [11].Osada T, Itoh A, Ikai A. Ultramicroscopy. 2003;97:353–357. doi: 10.1016/S0304-3991(03)00060-3. [DOI] [PubMed] [Google Scholar]
- [12].Berggren C, Johansson G. Anal. Chem. 1997;69:3651–3657. doi: 10.1021/ac970203e. [DOI] [PubMed] [Google Scholar]
- [13].Liu GD, Zhong TS, Huang SS, Shen GL, Yu RQ, Fresenius J. Anal. Chem. 2001;370:1029–1034. doi: 10.1007/s002160100890. [DOI] [PubMed] [Google Scholar]
- [14].Wilson MS, Rauh RD. Biosens. Bioelectron. 2004;19:693–699. doi: 10.1016/s0956-5663(03)00275-6. [DOI] [PubMed] [Google Scholar]


