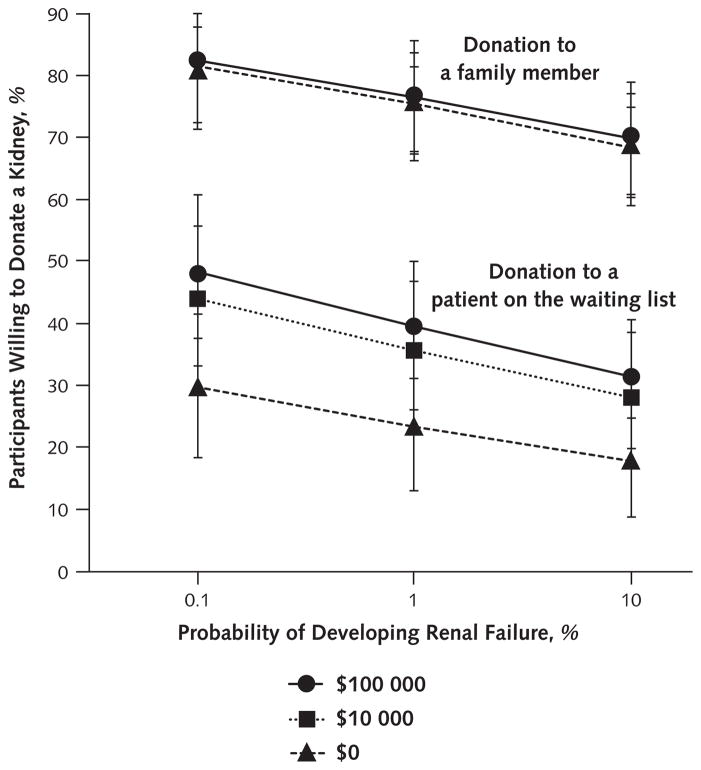
Figure 2. Adjusted proportions of participants willing to donate a kidney to family members and to patients on the waiting list as functions of payment and risk.
Scenarios in which donors would receive payment of $100 000, payment of $10 000, or no payment are illustrated. As evident from the roughly parallel nature of the lines within each recipient group, no interaction between risk and payment occurred when the recipient was a family member (odds ratio, 0.99 [95% CI, 0.94–1.04]) or when the recipient was the next patient on the waiting list (odds ratio, 0.97 [CI, 0.93–1.01]).

