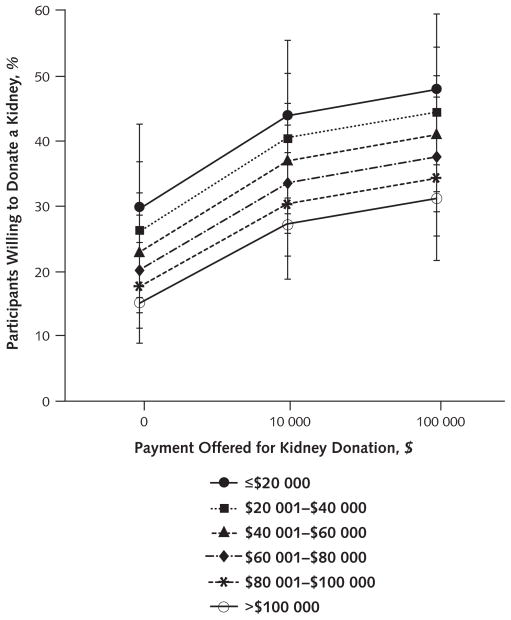
Figure 3.
Adjusted proportions of participants willing to donate a kidney to a patient on the waiting list as a function of income and payment.
Participants whose annual household incomes were ≤$20 000 through >$100 000 are illustrated. The plotted proportions have been adjusted for risk for renal failure, donor age, donor sex, version of the survey packet received, and interval of participant recruitment. Error bars represent 95% CIs around each adjusted proportion. As evident from the roughly parallel nature of the lines, no interaction between payment and income occurred (odds ratio, 1.01 [95% CI, 0.99 –1.03]).

