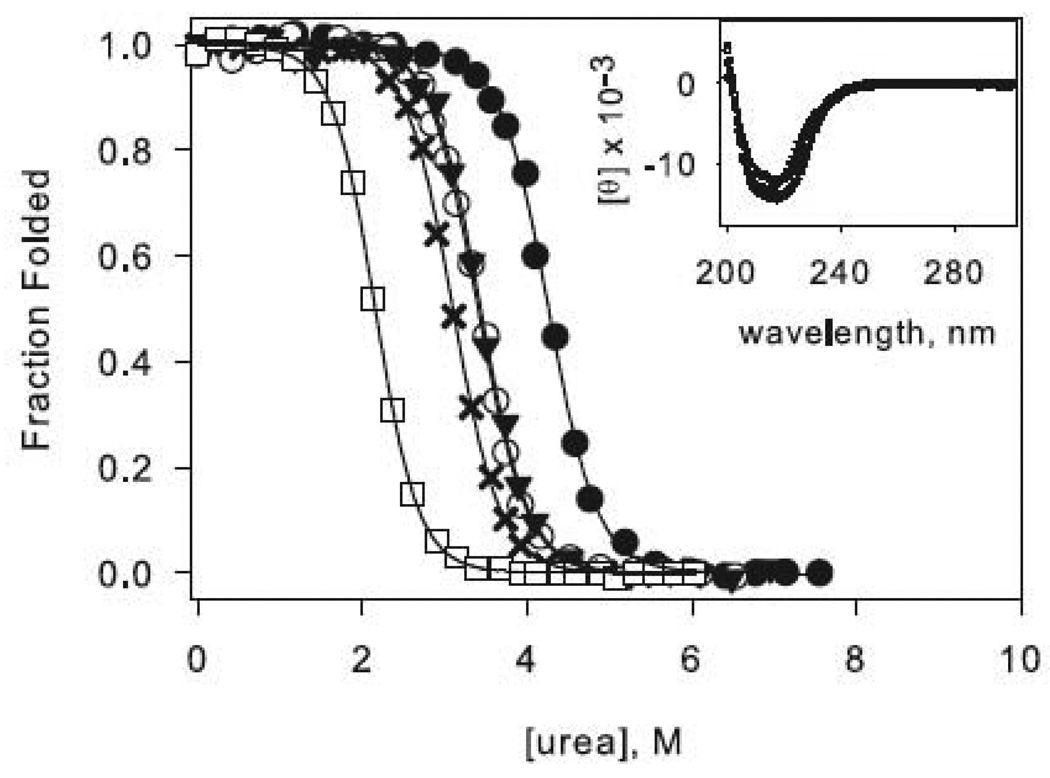
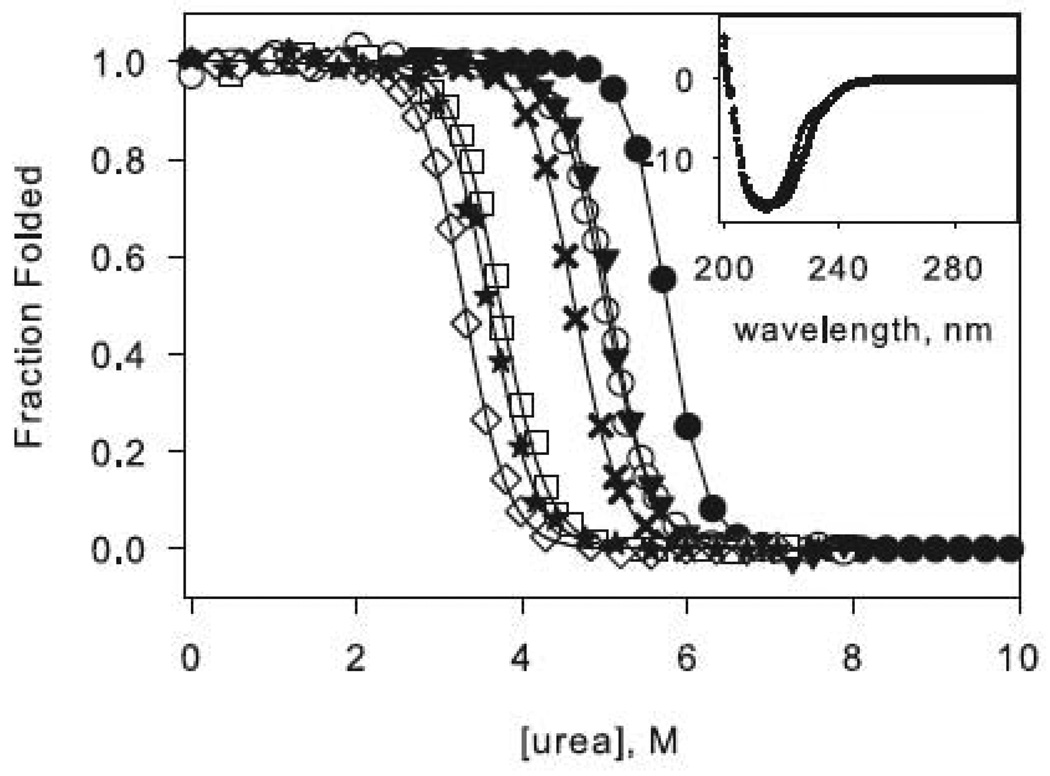
Figure 2.
Representative urea denaturation curves of variants of RNase H normalized to fraction folded. The two-state (a) and three-state (b) proteins are separated for clarity. Black lines represent the linear extrapolation fit assuming a two-state model. The data for the reference proteins RNH2 in panel (a) and RNH3 in panel (b) are shown as filled circles, and the mutations in each of these backgrounds are as follows: Q105G (open circles), W85A (closed triangles), F8A (filled crosses), I25A (open squares). In panel (b) F8A in the wild type background is shown as open diamonds, and W85A in the wild type background is shown as stars. CD spectra of the mutants are shown as insets in the same symbols.


