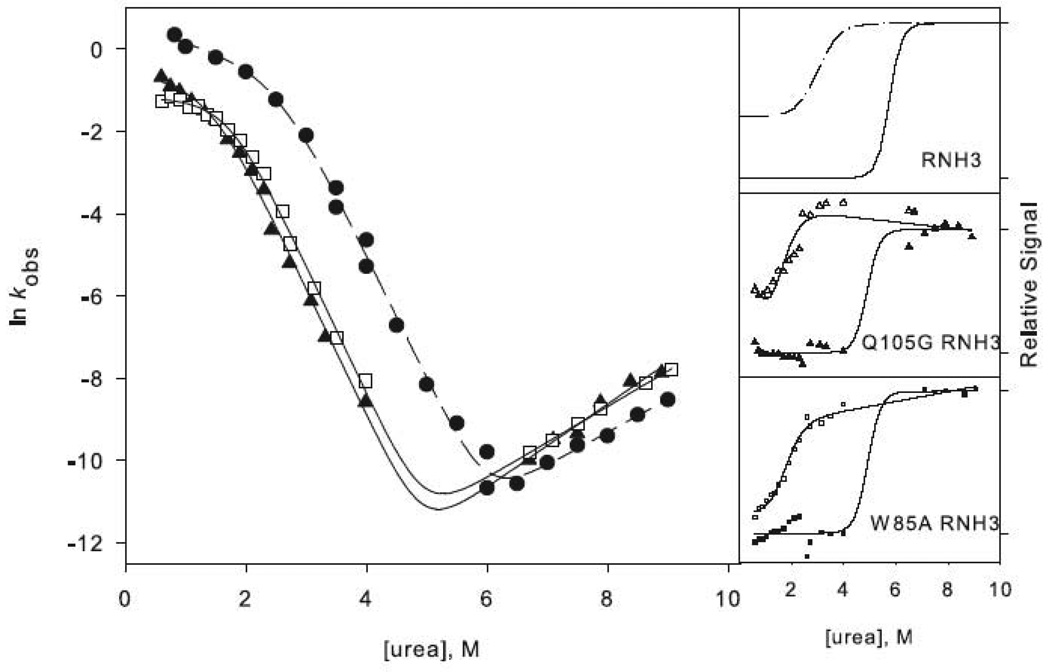
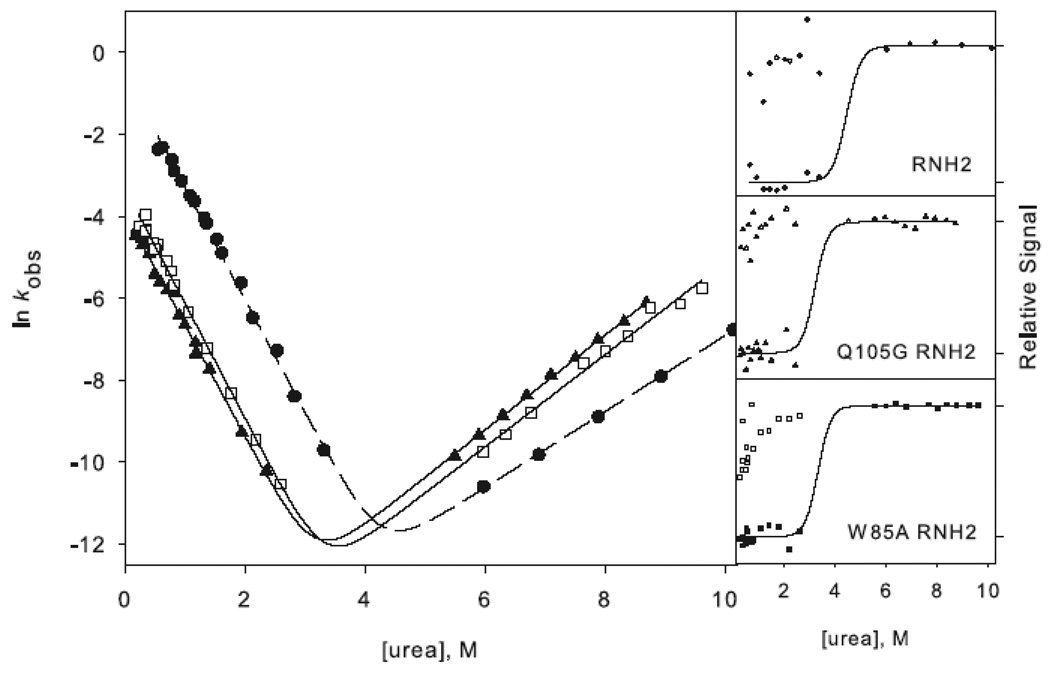
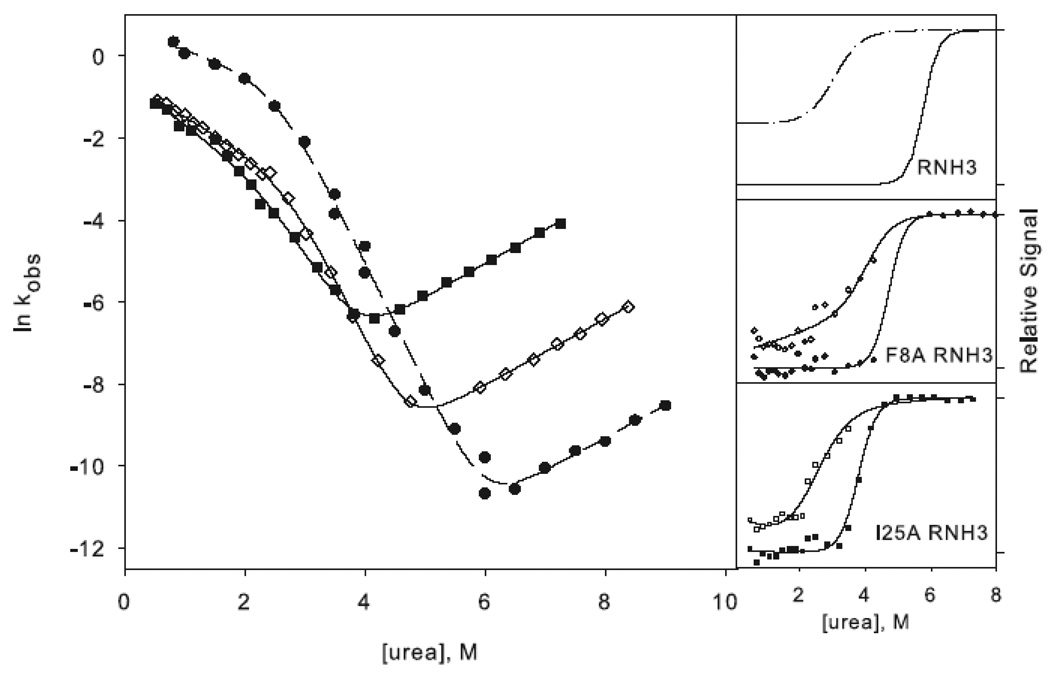
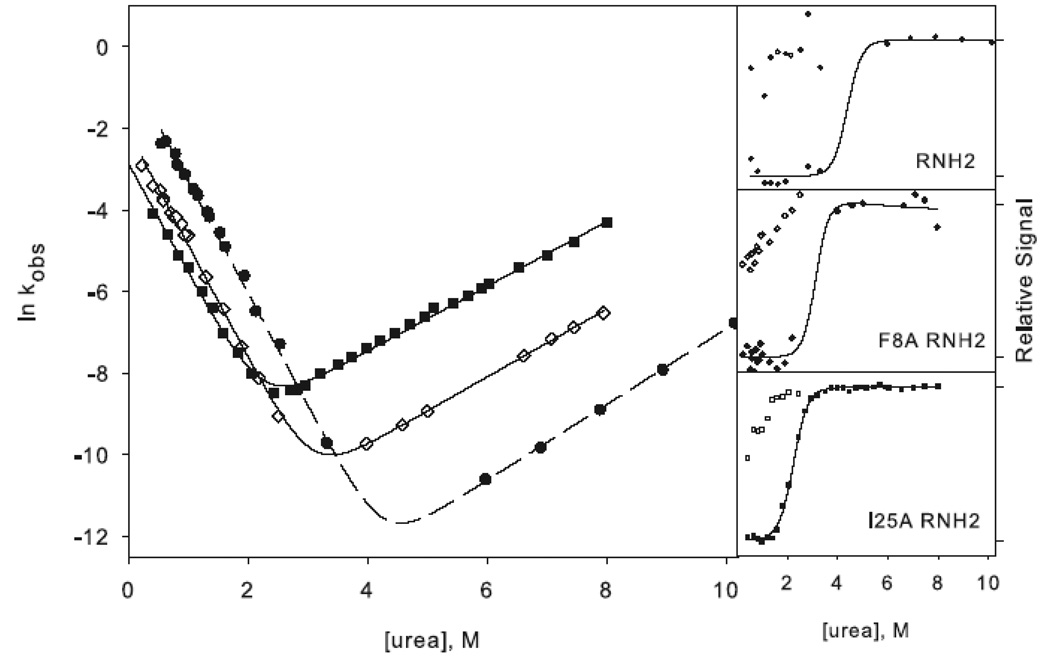
Figure 3.
Chevron plots for the three-state ((a) and (c)) and two-state ((b) and (d)) RNases H. The data for the reference proteins, RNH3 and RNH2, are filled circles. Panels (a) and (b) show the core mutation Q105G (filled triangles) and W85A (open squares). Panels (c) and (d) show the data for the periphery mutations F8A (open diamonds) and I25A (filled squares). The solid lines in (a) and (c) represent the fit to Scheme 1 and in (b) and (d) the fit to Scheme 2. The amplitudes are shown to the right of each chevron plot, with the initial signal shown as open symbols and final shown in closed symbols. The data are plotted as the fraction of relative overall signal. The black lines represent a linear extrapolation fit obtained by fixing the value for ΔG and m calculated from the chevron fit to show that they are consistent.


