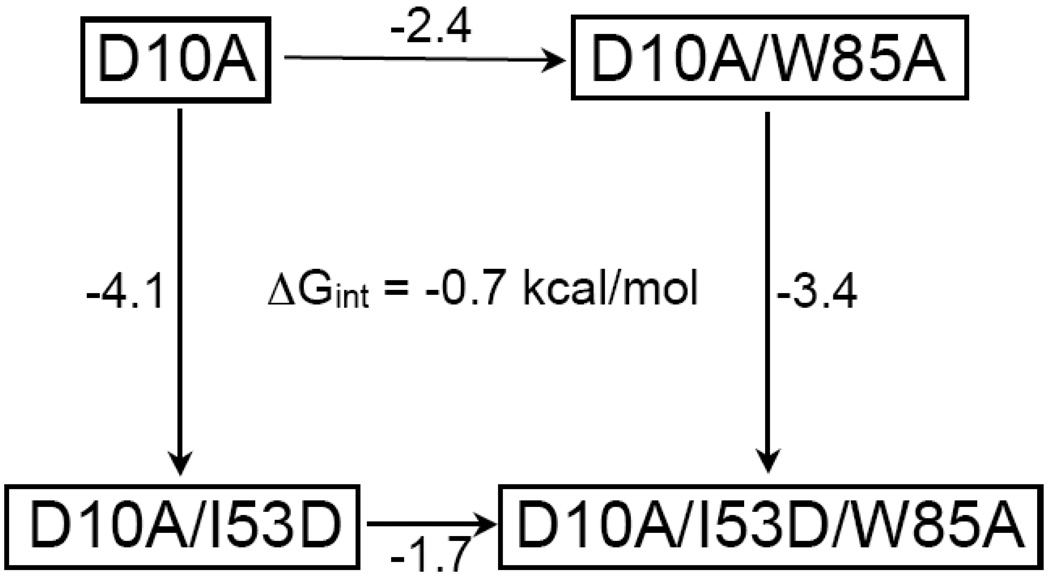
Figure 5.
A thermodynamic cycle addressing the interaction between Ile 53 and the mutated sites, represented here by Trp 85. The ΔΔG (kcal/mol) of unfolding upon making the indicated mutation is reported along the arrows. This cycle shows an interaction energy of 0.7 kcal/mol for residues 53 and 85.

