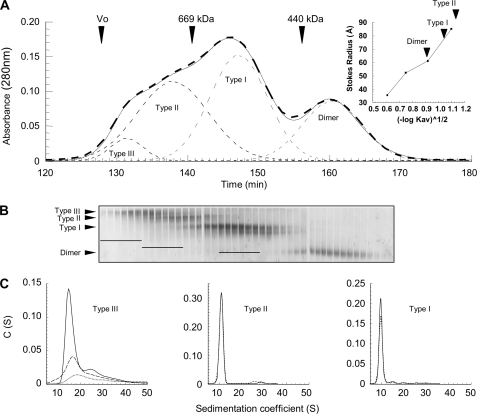
FIGURE 2.
Hsp90 oligomers purification by size exclusion chromatography and fractions analysis. A, solid line, elution profile of 500-μl sample of cross-linked Hsp90 (27 μm) in the presence of magnesium. The thin dashed lines correspond to the elution profile deconvolution as Gaussian curves, and the bold dashed line is the sum of Gaussian peaks. Arrows indicate the elution volume of blue dextran 2000 (Vo) and of molecular mass markers with known Stokes radii. The inset shows the calibration curve of the Stokes radius as a function of the partition coefficient (Kav), and the arrows denote the partition coefficient of each Hsp90 species (Table 1). B, analysis of eluted fractions 128–170 by 6/8% double layer native-PAGE. The bars drawn on the gel indicate the six preselected fractions for each oligomer type. C, analysis of preselected fractions by sedimentation velocity (AUC). The graphs represent the apparent sedimentation coefficients distribution C(S), analyzed as described under “Experimental Procedures.” Only the purest fractions selected for the following biochemical and biophysical characterization are shown, i.e. 129, 130, and 131 for Type III (dotted, dashed, and solid lines, respectively), 138 (dashed line) and 139 (solid line) for Type II, and 147 (dashed line) and 148 (solid line) for Type I. Depending on sample concentrations, sedimentation data were acquired at 230, 240, and 280 nm for Type III, II, and I eluted fractions, respectively.

