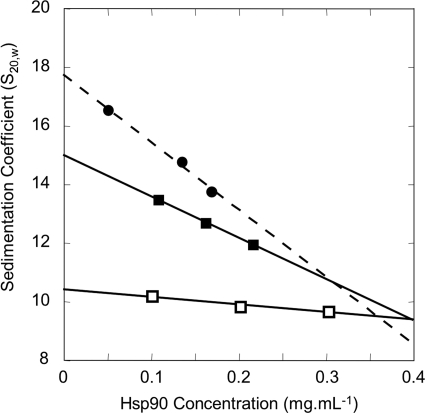
FIGURE 3.
Determination of standard sedimentation coefficients for each Hsp90 oligomer type. Sedimentation velocities were determined for three concentrations of each sample. □, STI (fractions 147–148); ■, STII (fractions 138–139). For the Type III oligomer (●), the estimation was done directly with previous results obtained for the raw fractions 129–131. The major peak on sedimentation coefficient distribution plot was taken into account, considering that the equilibrium is blocked because of cross-linking. Linear regressions permitted the determination of the S20,w0 for Type I and Type II (solid lines) and for Type III (dashed line). The results are presented in Table 1.

