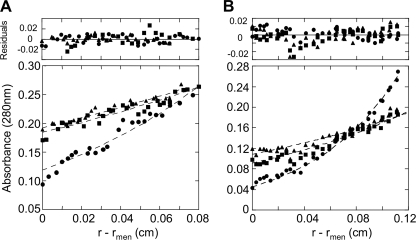
FIGURE 4.
Hsp90 quaternary structures analysis by sedimentation equilibrium. The symbols show the experimental radial distribution of Hsp90 oligomers at sedimentation equilibrium at 3400 (▴), 4100 (■), and 6000 rpm (●) performed at 4 °C. The dashed lines represent the best fit curves of global analysis of multiple sedimentation equilibrium data with the single ideal species model of nine fitted data sets (the three speeds indicated above at three Hsp90 oligomer concentrations). A, STI sedimentation equilibrium was performed at 0.20, 0.30, and 0.40 mg/ml. Only the 0.40 mg/ml concentration is shown. B, STII sedimentation equilibrium was performed at 0.05, 0.11, and 0.16 mg/ml. Only the 0.11 mg/ml concentration is shown. r is the radial distance, and rmen is the radial distance at the meniscus. The residuals represent the variation between the experimental data and those generated by the fit with a single species. The results are presented in Table 1.

