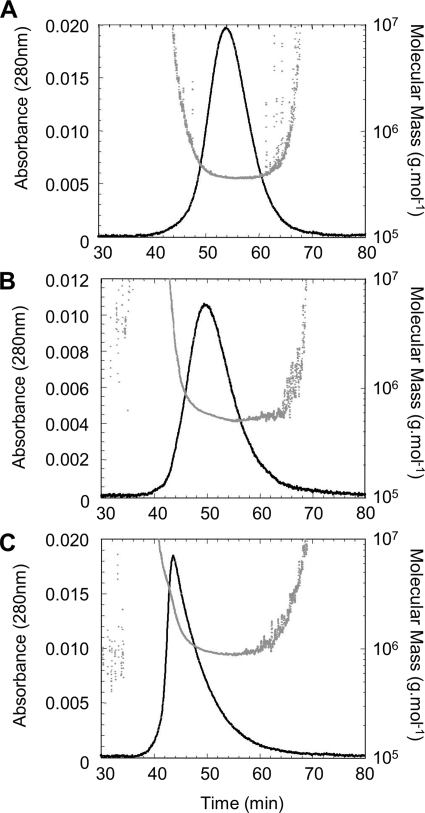
FIGURE 5.
Hsp90 quaternary structures analysis by SEC-MALLS. STI, STII, and STIII samples properties were followed using a MALLS detector during the elution from the double size exclusion chromatography (Superdex 200 60 cm and Sepharose 6B 16 cm). The solid curve represents the UV absorbance profile at 280 nm overlaid with the scatter plot, which corresponds to the mass estimated from light scattering profile and concentration measurement versus the elution time. The results are presented in Table 1.

