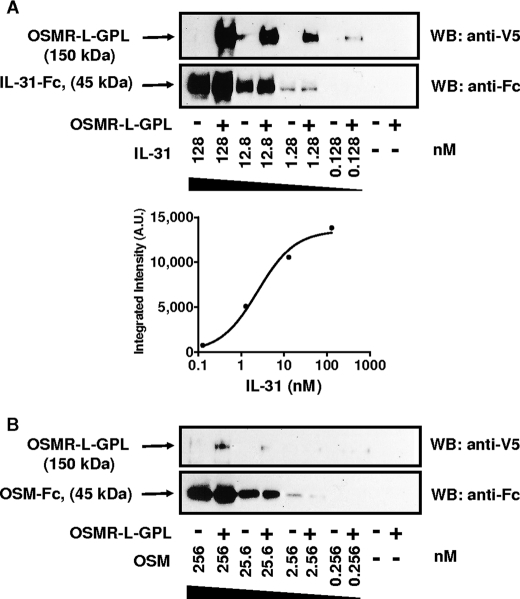
FIGURE 3.
Binding analysis of OSMR-l-GPL. Different concentrations of cytokines fused to the IgG1 Fc fragment were incubated in the presence of OSMR-L-GPL (4 nm) for 16 h at 4 °C before a pulldown with protein A beads. A, IL-31/OSMR-L-GPL association was detected using a monoclonal anti-V5 antibody coupled to peroxidase. An anti-IgG1 polyclonal antibody coupled to peroxidase was used to control the cytokines-Fc loading. Signals were integrated, and GraphPad software was used to plot the association curve to determine the Kd value. B, association with OSM. A.U., arbitrary units; WB, Western blot.

