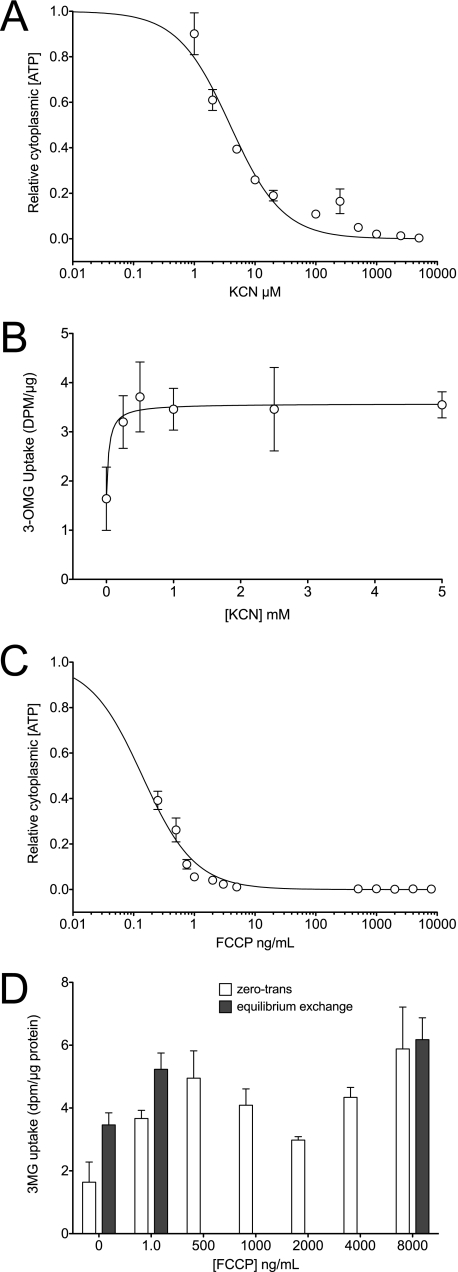
FIGURE 3.
Concentration dependence of ATP depletion (A) and transport stimulation (B) by KCN or concentration dependence of ATP depletion (C) and transport stimulation (D) by FCCP. Cells were exposed to varying [poison] for 10 min at 37 °C and then cooled, and cellular ATP content was measured as described previously. A and C, ordinates, relative to cytoplasmic [ATP] (luminescence per unit of cell protein); A and C, abscissas, [poison]. B and D, ordinates, 3-OMG uptake in dpm/μg protein; B and D, abscissas, [poison]. Each experiment was repeated at least three times, and results are shown as mean ± S.E. Curves in A and C were computed assuming that [ATP] decreases in a saturable manner with [poison]. K0.5 for [ATP] depletion by KCN <3.9 ± 0.6 μm and by FCCP is 0.14 ± 0.01 ng/ml. The curve in B was computed by nonlinear regression assuming that sugar uptake increases in a saturable manner with [poison]. K0.5 for transport stimulation by KCN is 0.04 ± 0.03 mm. D, FCCP stimulation of zero-trans (open bars) and equilibrium exchange (shaded bars) transport are shown.

