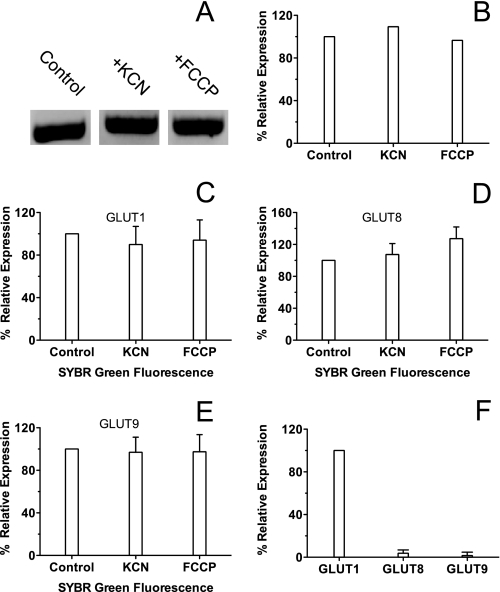
FIGURE 4.
RT-PCR of bEnd.3 cells. A, end point reverse transcriptase-PCR of bEnd.3 cells using a GLUT1 primer. Cells were incubated for 10 min in either PBS, PBS + 5 mm KCN, or PBS + 8 μg/ml FCCP before isolating total RNA, and reverse transcriptase-PCR was carried out using a GLUT1 primer. Samples were run on a 1.5% agarose gel. B, quantitation of GLUT1 band densities from end point RT-PCR. Ordinate, relative expression (%). Experimental conditions (control PBS, PBS + KCN, and PBS + FCCP) are shown below the abscissa. C–F, quantitative RT-PCR of bEnd.3 cells. Ordinate and abscissa are as in B. Cells were processed as in A and 100 ng of total RNA was used for each reaction, which was run twice with four replicates for each condition. Results are shown as mean ± S.E. Primers specific to GLUT1 (C), GLUT8 (D), and GLUT9 (E) were used in each reaction. F, in this chart, the amount of GLUT8 and GLUT9 message in control cells is expressed relative to GLUT1 message in control cells.

