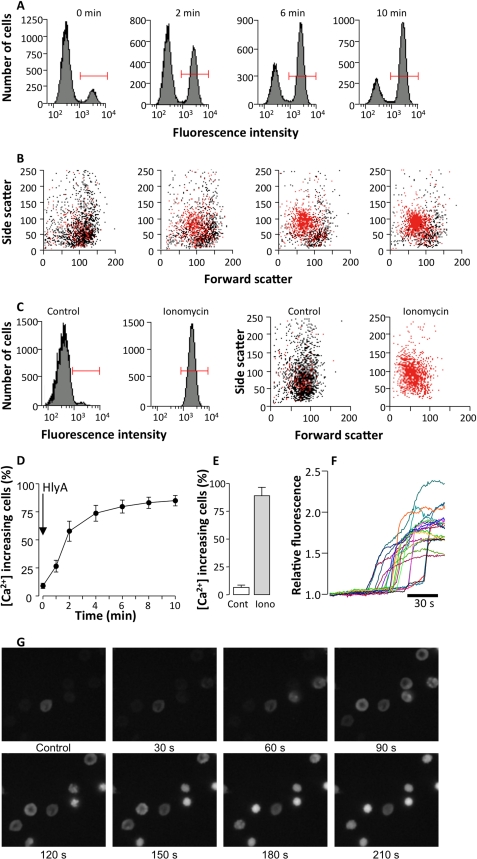
FIGURE 2.
Effect of HlyA on [Ca2+]i in human erythrocytes. A, number of cells as a function of fluo 4 fluorescence signal shows two populations of cells at time 0, 2, 6, and 10 min after HlyA is applied (3 ng ml−1). The population of cells with a substantial rise in [Ca2+]i (as indicated by the red bars) is defined as [Ca2+]i increasing cells. B, side scatter as a function of forward scatter at time 0, 2, 6, and 10 min after HlyA is applied (3 ng ml−1). The cells marked in red (the same population as marked with the red bar in A show a rise in [Ca2+]i. Each dot represents a single erythrocyte. The values on the axis are arbitrary. C, the corresponding effect of the Ca2+ ionophore, ionomycin. At the left the numbers of cells are shown as a function of fluo 4 fluorescence signal. Again during control there are two populations of cells, one with low and a smaller with higher [Ca2+]i. Only a single population of cells with high [Ca2+]i was observed after ionomycin was applied (1 μm, 10 min). At the right the side scatter is shown as a function of forward scatter during control, and 10 min after ionomycin was applied. The cells marked in red (the same population as marked with a red bar in the left panels) show a rise in [Ca2+]i. Each dot represents a single erythrocyte. The values on the axis are arbitrary. D, the percentage of erythrocytes with a rise in [Ca2+]i in response to HlyA. The values are the means ± S.E. (n = 5). E, the mean values of cells with a rise in [Ca2+]i after addition of ionomycin (1 μm). The values are the means ± S.E. (n = 5). F, the traces show the change in fluo 4 fluorescence over time in 23 erythrocytes in response to HlyA. G, imaging of fluo 4-loaded human erythrocytes exposed to HlyA (25 ng ml−1).

