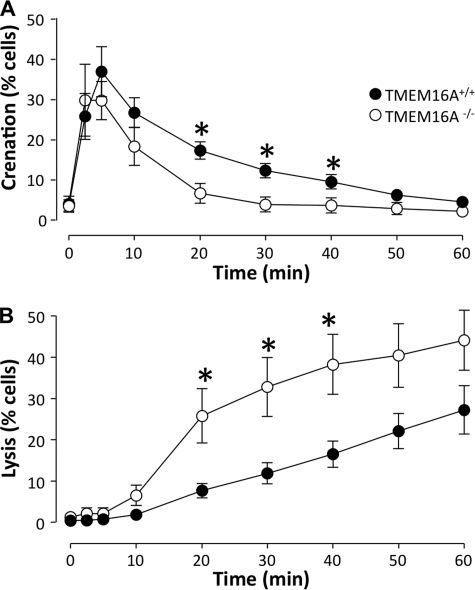
FIGURE 4.
HlyA-induced crenation and lysis in erythrocytes from TMEM16A−/−versus TMEM16A+/+ mice. A, the number of erythrocytes isolated from TMEM16A+/+ and TMEM16A−/− mice, which crenate in response to HlyA (25 ng ml−1). B, the subsequent lysis of erythrocytes isolated from TMEM16A+/+ and TMEM16A−/− mice in response to HlyA. The values are given as the means ± S.E. (n = 8 for TMEM16A+/+ mice and n = 6 for TMEM16A−/− mice). The asterisks indicate statistically significance between the values obtained from TMEM16A−/− and TMEM16A+/+ mice.

