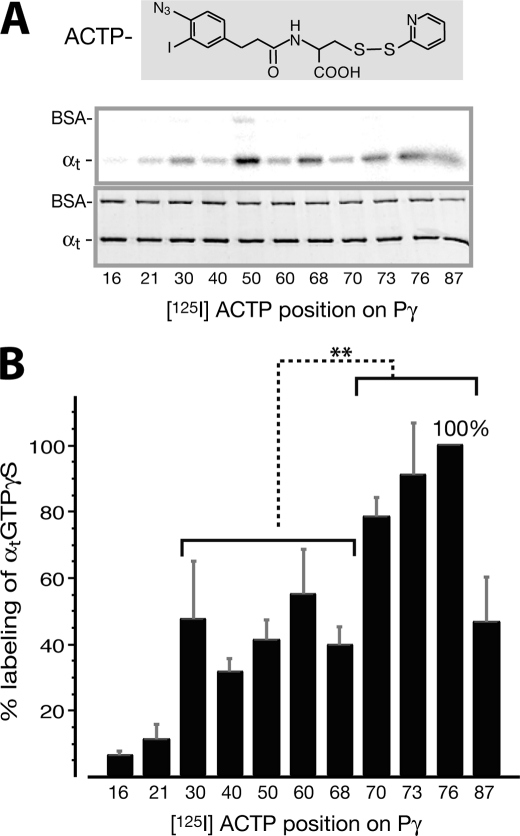
FIGURE 1.
Profiling of [125I]ACTP label transfer to αtGTPγS from various positions throughout the Pγ molecule. A, radiolabel transfer from [125I]ACTP-Pγ to αtGTPγS was detected by autoradiography (top panel). Shown in the bottom panel is the Coomassie-stained gel, below which the corresponding [125I]ACTP derivatization positions on Pγ are listed. Photocross-linking reactions were performed with 1 μm αtGTPγS and 0.8 μm [125I]ACTP-Pγ (see “Experimental Procedures”). BSA was included in the reactions as an internal control. B, profile of quantified label transfer to αtGTPγS. Each data value is expressed as a percentage relative to the maximum labeling (position 76, ±15.7%) and presented as an average ±S.D. (error bars) of four separate experiments. The amount of label transfer to αtGTPγS from each Pγ position was normalized for the αt protein amount and the specific activity of the corresponding [125I]ACTP-Pγ probe (supplemental Table S1 or Ref 28). Statistical analyses were performed by t test (Microsoft Excel). *, p = 0.01–0.05 (significant); **, p = 0.001–0.01 (very significant); ***, p < 0.001 (extremely significant); ns, p > 0.05 (not significant). As shown in the figure, there is a very significant difference between label transfer from the Pγ Phe30–Cys68 region and that from the Trp70–Leu76 region. Position 87 is not included in the latter group for statistical analysis because label transfer from the hydrophilic ACTP probe substituting the hydrophobic Ile87 residue could not accurately reflect the interaction between this position and αtGTPγS (see the discussion of Figs. 1 and 2 under “Results”). The difference between each position and position 76 is also analyzed: positions 16 and 21 (***); 40, 50, and 68 (**); 30, 60, and 87 (*); 70 and 73 (not significant).

