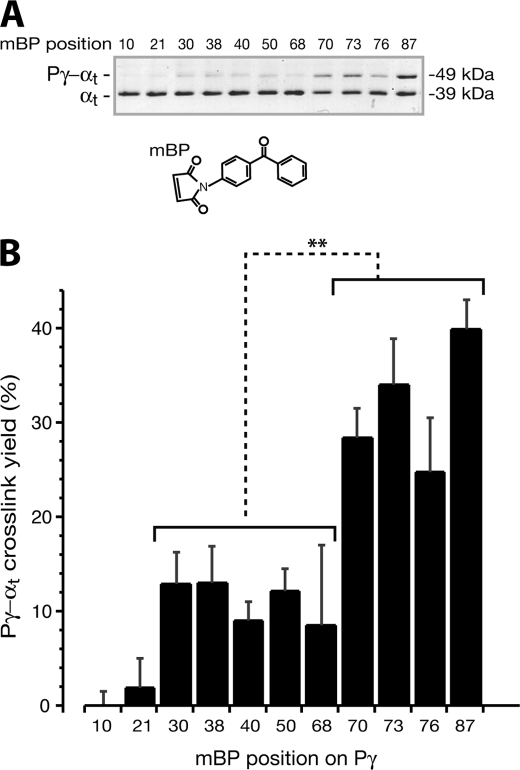
FIGURE 2.
Profiling of the Pγ-αtGTPγS interaction using mBP photoprobes. A, photocross-linked mBP-Pγ-αtGTPγS is shown as a higher band above the αt band on the Coomassie-stained SDS gel. The photocross-linking reactions were performed as described under “Experimental Procedures.” Each reaction included 1.6 μg of αtGTPγS and an equal molar amount of mBP-Pγ in the HEPES buffer (10 mm HEPES, pH 7.5, 120 mm NaCl, 5 mm MgCl2). DTT was added at a concentration of 2 mm to prevent possible nonspecific cross-link. B, the photocross-link efficiency of mBP-Pγ and αtGTPγS at each Pγ position was quantified as a percentage ratio of the protein amount in the cross-link band versus the sum in both the αt band and the cross-link band. Each bar represents an average ± S.D. (error bars) of six separate experiments. The mBP derivatization positions on Pγ are listed at the bottom. The difference in cross-link efficiency of αtGTPγS with two groups of Pγ positions, Phe30–Cys68 and Trp70–Ile87, is very significant. t test of each position against position 87 is shown: positions 10, 21, 30, 38, 40, 50, and 68 (***); positions 70 and 76 (**); and position 73 (not significant (ns)).

