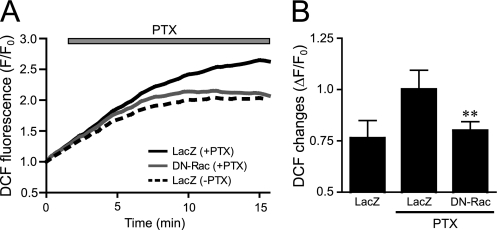
FIGURE 5.
Effects of DN-Rac on PTX-induced ROS production. A and B, average changes (A) and peak increases (B) in PTX-induced F/F0 of dichlorofluorescein from time course experiments. The increases in PTX-induced fluorescence of dichlorofluorescein were calculated by the value of maximal fluorescence intensity (F) during 20 min of stimulation and initial value of fluorescence, F0. *, p < 0.05; **, p < 0.01 versus PTX-untreated or LacZ-expressing cells. Error bars, S.E.

