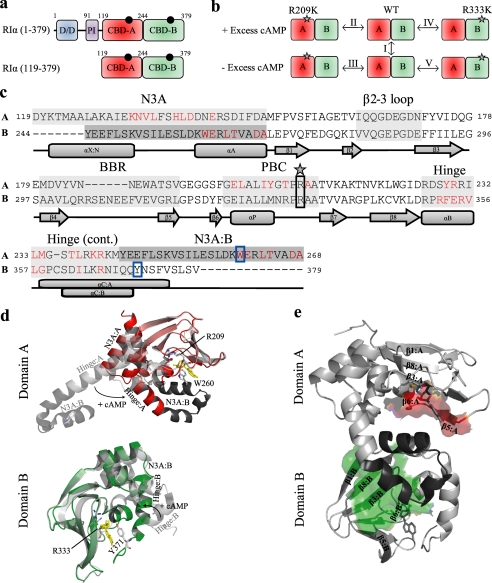
FIGURE 1.
Domain and structure overview of RIα. a, shown is a schematic representation of the domain organization of the full-length RIα-subunit of PKA as well as the RIα-(119–379) construct studied here by NMR. The black circles indicate molecules of cAMP bound to the two tandem C-terminal CBDs, which are shown in different shades of green. The dimerization/docking (D/D) domain is shown in blue, and the pseudoinhibitory (PI) site is shown in purple. Domain boundaries are indicated by residue numbers located above the respective domains. The domain boundary is defined by residue Tyr-244. b, shown is an overview of the H/D comparisons (I-V) between various states of the RIα-(119–379) construct for the wild-type (WT), R209K, and R333K mutants, which were all probed by H/D exchange in the presence and absence of 2 mm excess cAMP. The gray stars indicate the site of the mutation. c, shown is sequence alignment of the two CBDs of the RIα-(119–379) construct. The A and B labels to the left of the sequence refer to CBD-A and -B, respectively. Major allosteric hot spots are shaded with gray, which include the N3A motif, β2-3 loop, BBR, PBC, and hinge. The lid of domain A is contained within the N3A motif of B, whereas the lid of domain B is contained with the hinge of domain B. A darker shade of gray has been used to indicate that the region from Tyr-244 to Ala-268 belongs to domain B. Residues shown in red are those that contact the C-subunit, according to changes in solvent-accessible surface area for the PDB code 2QCS structure with and without the C-subunit present. The star and solid black box indicate the site of the R209K and R333K mutations. The solid blue box shows the position of the capping residues, Trp-260 and Tyr-371, for domains A and B, respectively. Secondary structure elements are shown below the sequence. d, shown is an overlay of the cAMP-bound (PDB code 1RGS) and C-subunit bound (PDB code 2QCS) crystal structures for domain A (top) and domain B (bottom). The cAMP-bound structure is shown in color, whereas the C-subunit bound structure is shown in gray. The N3A motif of domain B is depicted in the top panel as a darker shade of gray. The hinge and N3A motifs are labeled as well as are the conserved arginines (i.e. Arg-209 and Arg-333) and capping residues (i.e. Trp-260 and Tyr-371), which are shown as sticks and colored according to their atom types. Movement of the hinge upon binding of cAMP is shown with a black arrow, and molecules of cAMP are shown with yellow sticks. e, interdomain contacts between domains A and B are shown. The red- and green-colored surfaces show the contacts that the β-subdomain of CBD-A and CBD-B make with the other domain, respectively. The Tyr-244—Ala-268 region shaded in dark gray in panel c is shown in panel e with a dark gray ribbon. The domain interfaces were identified by comparing the solvent-accessible surface area values of domain deletion mutants to those generated for the wild-type protein (further details are available in supplemental Fig. S5 and its caption).

