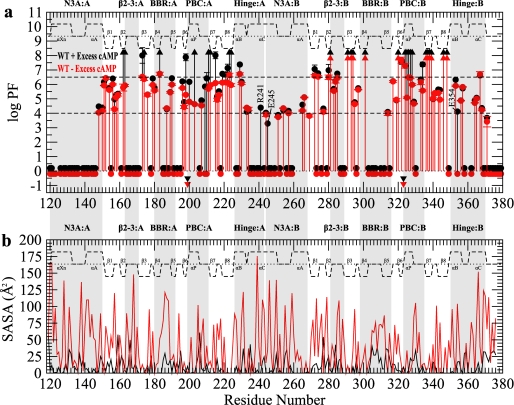
FIGURE 3.
H/D exchange profiles for wild-type RIα-(119–379). a, shown is a PF plot for wild-type RIα-(119–379) in the presence (black) or absence (red) of 2 mm excess cAMP. Circles appearing at PF values >1 indicate residues with a quantifiable PF, whereas upwards triangles at PF ∼8 indicate lower limit PF values for residues that did not exchange for the duration of the experiment. Circles located around a PF of 0 indicate residues that completely exchanged within the dead-time of the experiments. Inverted triangles indicate residues that were too broad in the HSQC of the 15N-labeled sample to be used as a probe of H/D exchange. The secondary structure is shown as dashed lines above the protection factors with the α-helices and β-sheets labeled. Major allosteric hot-spots are shaded in gray. WT, wild type. b, shown are calculated solvent-accessible surface area (SASA) values for the side-chain (red) and backbone (black) atoms using the cAMP-bound form of the R-subunit.

