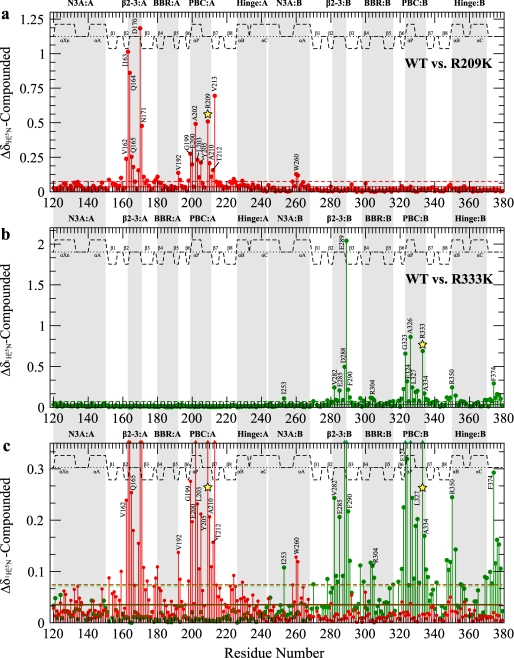
FIGURE 4.
Compounded amide chemical shift differences between wild-type (WT) RIα-(119–379)·cAMP2 and the R209K (a) and R333K (b) mutants, all in the presence of 2 mm excess cAMP, are shown. The average chemical shift (solid line) as well as 1 S.D. above the average (dashed line), are shown with red (R209K) or green (R333K) horizontal lines. c, overlap of plots in panels a and b vertically re-scaled to facilitate the comparison of smaller chemical shift changes induced by R209K (red) and R333K (green). Colored triangles at the top of the panel indicate data that is off-scale. Major allosteric hot spots are shaded in gray, and the site of the mutation is indicated by a yellow star. The secondary structure is shown as dashed lines above the data with the α-helices and β-sheets labeled.

