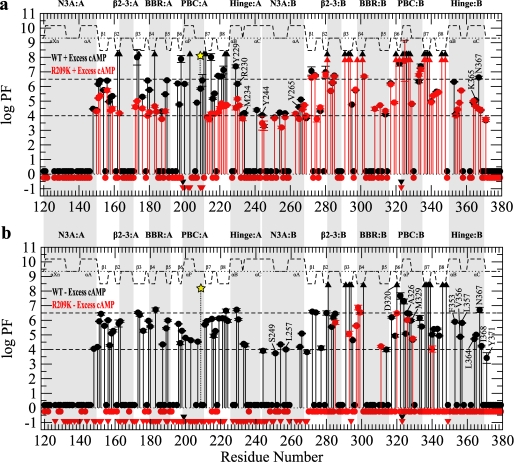
FIGURE 5.
H/D exchange profiles for RIα-(119–379) with domain A silenced by the R209K mutation. a, shown is a PF plot for the wild-type RIα-(119–379) (black) and R209K (red) in the presence of 2 mm excess cAMP. b, shown is a PF plot for the wild-type (black) and R209K (red) in the absence of excess cAMP. All symbols and labels are the same as in Fig. 3.

