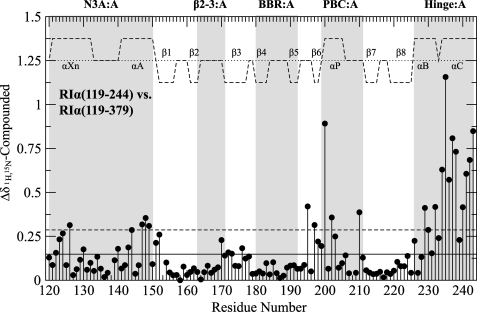
FIGURE 7.
Compounded chemical shift differences between the wild-type RIα(119–244) CBD-A construct and the wild-type RIα-(119–379) CBD-A,B construct both in the presence of excess cAMP. The average chemical shift difference (solid line) as well as 1 S.D. above the average (dashed line) are shown with black horizontal lines. Major allosteric hot spots are shaded in gray, and the secondary structure is shown as dashed lines above the data with the α-helices and β-sheets labeled.

