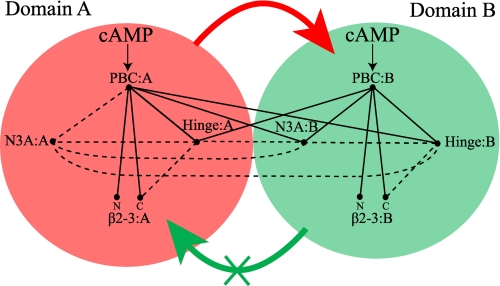
FIGURE 8.
Schematic diagram of the intra- and interdomain couplings among the critical allosteric sites of RIα-(119–379) as revealed by the present investigation. The red- and green-shaded circles refer to CBD-A and -B, respectively. The N3A motif, β2-3 loop, PBC, and hinge regions are labeled, whereas the BBR was omitted to simplify the figure. The N and C labels denote the N and C terminus of the β2-3 loop, respectively. The binding of cAMP to the PBC of both domains is indicated by arrows. The PBC sites of each CBD are connected by solid lines to other allosteric hot spots if they fulfill the following conditions: 1) they include residues in direct contact with the PBC either in the presence or absence of cAMP (7, 8), and 2) the region connected to the PBC is perturbed through local unfolding pathways as probed by class II or III protection factors and/or through changes in the local environment as probed by amide chemical shift variations. The dashed lines indicate regions with contacting residues but for which there is no experimental evidence in the present study to indicate whether the two regions are indeed allosterically linked. The absence of a given line between a pair of allosteric sites implies that there are no contacts between those two allosteric sites either in the presence or absence of cAMP. The thick red arrow means that the global unfolding of CBD-A promotes the global unfolding of CBD-B, whereas the thick green arrow with an X indicates that CBD-B is not able to appreciably affect the global unfolding of domain A.

