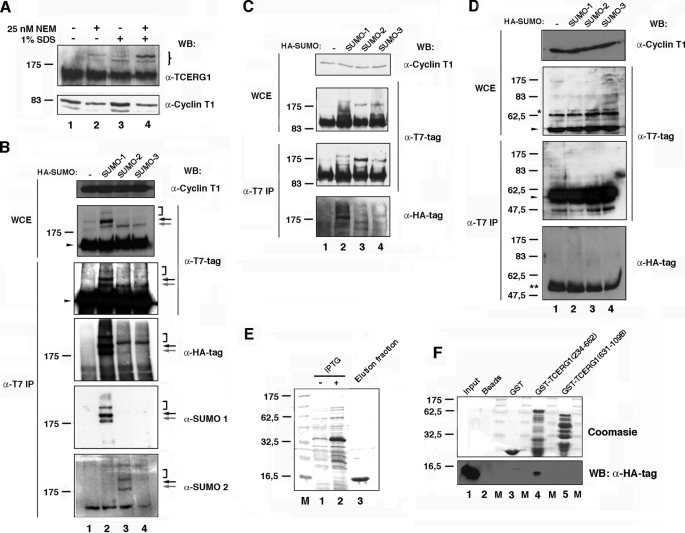
FIGURE 1.
TCERG1 is a sumoylation substrate in vivo and interacts directly with human Ubc9. A, Western blotting (WB) analyses of endogenous TCERG1 from HeLa cells with or without 25 nm NEM and/or 1% SDS. Specific antibodies against TCERG1 and cyclin T1 (as a loading control) were used to localize the proteins. The brace indicates the positions of the two predominant slow migrating bands in the samples treated with 25 nm NEM and 1% SDS buffer. Molecular masses in kDa are indicated to the left. B, HeLa cells were cotransfected with a plasmid encoding T7-tagged TCERG1 along with empty vector (lane 1) or vectors encoding HA-SUMO-1 (lane 2), HA-SUMO-2 (lane 3), or HA-SUMO-3 (lane 4). WCE were directly analyzed by Western blotting or subjected to immunoprecipitation (IP) with T7-specific antibodies followed by SDS-PAGE and Western blotting with anti-T7, anti-HA, anti-SUMO-1, anti-SUMO-2, or anti-cyclin T1 antibodies. Specific higher molecular weight forms of TCERG1 are visible above the position of the 175-kDa marker and are indicated by arrows and bracket (see description in text). The unmodified form of TCERG1 is indicated by a closed arrowhead. C and D, same experiment described for B was repeated but using plasmids encoding T7-tagged amino- (C) and carboxyl-terminal (D) regions of TCERG1. *, nonspecific band present in WCE and reactive to anti-T7 antibodies. **, immunoglobulin fraction eluted from the matrix. E, purification of HA-tagged Ubc9. Lanes 1 and 2, crude E. coli lysates with (+) or without (−) isopropyl 1-thio-β-d-galactopyranoside (IPTG); lane 3, elution fraction after thrombin cleavage (HA-hUbc9). F, amino-terminal region of TCERG1 interacts directly with human Ubc9. HA-tagged Ubc9 was incubated with equal amounts of GST or GST-TCERG1(234–662) and GST-TCERG1(631–1098) bound to glutathione-Sepharose beads. Bound proteins (lanes 2–5) were eluted with SDS-PAGE loading buffer and resolved in a 15% SDS-polyacrylamide gel along a sample of the input (lane 1). The upper part of the gel was stained with Coomassie Blue R-250 to visualize the eluted GST fusion proteins. and the lower part was transferred to a membrane and incubated with an anti-HA-specific antibody to detect Ubc9. Molecular masses (M) in kDa are indicated to the left.

