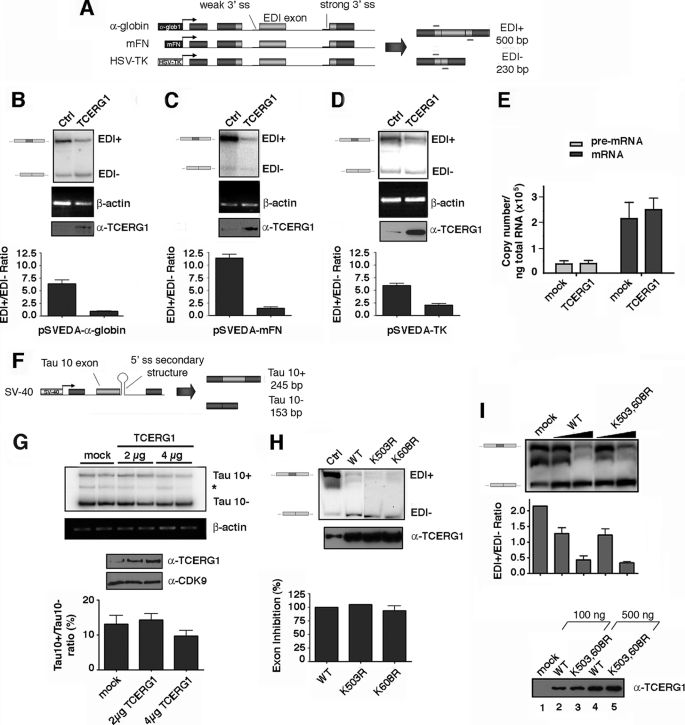
FIGURE 4.
Effect of wild-type TCERG1 and sumoylation mutants on EDI alternative splicing. A, schemes of the minigenes carrying the different promoters. Exons are represented by boxes and introns by lines. Alternative EDI isoforms generated by inclusion (EDI+, 500 bp) or skipping (EDI−, 230 bp) of EDI exon are indicated. Also indicated are the position of the primers used to amplify the mRNA splicing variants. α-globin, human α-globin; mFN, human fibronectin; HSV-TK, herpes simplex virus-thymidine kinase; ss, single strand. B–D, effect of TCERG1 overexpression on alternative splicing elicited by minigenes carrying the α-globin (A), fibronectin (B), and HSV-TK (C) promoters. RNA splicing variants were detected by radioactive RT-PCR, and the products of amplification were separated by polyacrylamide gels. β-Actin was amplified as a control. A sample of cell lysate was immunoblotted with anti-TCERG1 antibody to demonstrate the expression levels. Ratios between radioactivity in EDI+ bands and EDI− bands from two independent experiments are shown below the panels. Ctl, control. E, quantitative analysis of the amount of nascent transcript and total mRNA species derived from the α-globin EDI minigene upon cotransfecting with wild-type TCERG1 by real time PCR. Quantification of the experimental data from four independent experiments is shown in graphic form. F, schematic representation of the tau exon 10 minigene system. Alternative spliced mRNAs containing tau exon 10 (Tau 10+, 245 bp) and mRNAs with tau exon 10 skipped (Tau 10−, 153 bp) are shown in the figure. G, effect of TCERG1 overexpression in the regulation of tau exon 10. RT-PCR analysis of the cotransfections of tau 10 minigene with TCERG1. β-Actin was amplified as a control. A sample of cell lysate was immunoblotted with anti-TCERG1 antibody to demonstrate the expression levels. Ratios between radioactivity in tau 10+ bands and tau− bands from two independent experiments are shown below the panel. H, cotransfection assays were carried out with wild type and sumoylation mutants of TCERG1 and the α-globin EDI minigene. Patterns of EDI minigene splicing were analyzed as in previous panels. I, curve dose-response for wild-type (WT) TCERG1 and double mutant variant (K503R,K608R (K503,608R)) on EDI alternative splicing. The α-globin EDI minigene and the indicated TCERG1 constructs were cotransfected at 100 (lanes 2 and 4) and 500 (lanes 3 and 5) ng. RNA splicing variants were detected by radioactive RT-PCR, and the products of amplification were separated by polyacrylamide gels (top panel). Experimental data from two independent experiments were quantified and are shown in graphic form (middle panel). A sample of cell lysates were immunoblotted with anti-TCERG1 antibody to demonstrate the expression levels (bottom panel).

